

We considered an international carbon price (carbon trading price) and a domestic
carbon price (marginal abatement cost (MAC) of carbon). The international carbon
price is determined using MAC curves, which derive from carbon credit demand and
supply curves. The domestic carbon price is determined by domestic reductions and
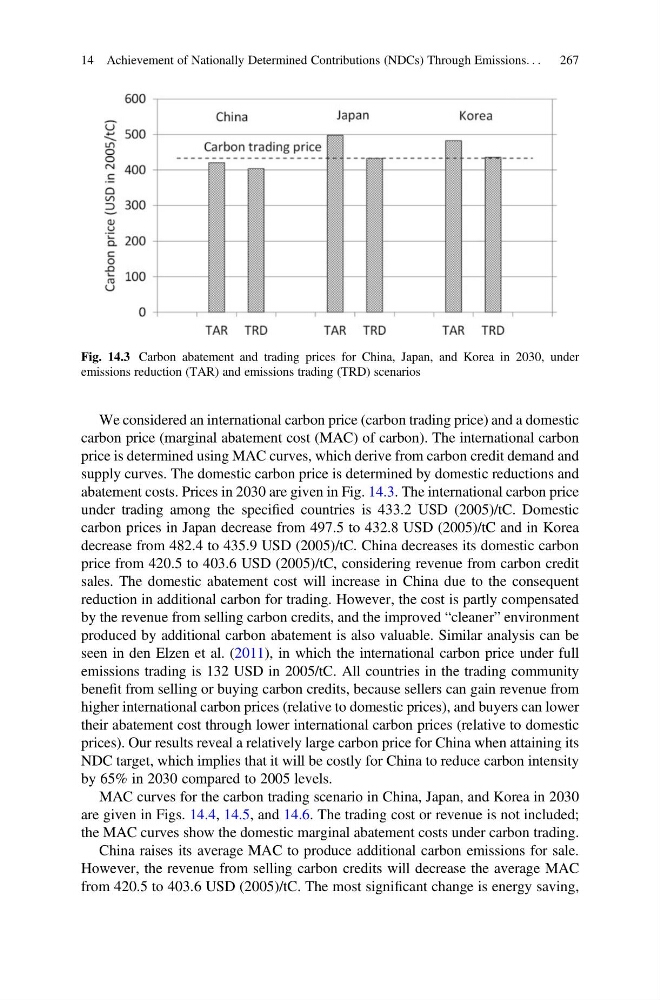
abatement costs. Prices in 2030 are given in Fig. 14.3. The international carbon price
under trading among the specified countries is 433.2 USD (2005)/tC. Domestic
carbon prices in Japan decrease from 497.5 to 432.8 USD (2005)/tC and in Korea
decrease from 482.4 to 435.9 USD (2005)/tC. China decreases its domestic carbon
price from 420.5 to 403.6 USD (2005)/tC, considering revenue from carbon credit
sales. The domestic abatement cost will increase in China due to the consequent
reduction in additional carbon for trading. However, the cost is partly compensated
by the revenue from selling carbon credits, and the improved “cleaner” environment
produced by additional carbon abatement is also valuable. Similar analysis can be
seen in den Elzen et al. (2011), in which the international carbon price under full
emissions trading is 132 USD in 2005/tC. All countries in the trading community
benefit from selling or buying carbon credits, because sellers can gain revenue from
higher international carbon prices (relative to domestic prices), and buyers can lower
their abatement cost through lower international carbon prices (relative to domestic
prices). Our results reveal a relatively large carbon price for China when attaining its
NDC target, which implies that it will be costly for China to reduce carbon intensity
by 65% in 2030 compared to 2005 levels.
MAC curves for the carbon trading scenario in China, Japan, and Korea in 2030
are given in Figs. 14.4, 14.5, and 14.6. The trading cost or revenue is not included;
the MAC curves show the domestic marginal abatement costs under carbon trading.
China raises its average MAC to produce additional carbon emissions for sale.
However, the revenue from selling carbon credits will decrease the average MAC
from 420.5 to 403.6 USD (2005)/tC. The most significant change is energy saving,
Fig. 14.3 Carbon abatement and trading prices for China, Japan, and Korea in 2030, under
emissions reduction (TAR) and emissions trading (TRD) scenarios
14 Achievement of Nationally Determined Contributions (NDCs) Through Emissions. . .
267
carbon price (marginal abatement cost (MAC) of carbon). The international carbon
price is determined using MAC curves, which derive from carbon credit demand and
supply curves. The domestic carbon price is determined by domestic reductions and
abatement costs. Prices in 2030 are given in Fig. 14.3. The international carbon price
under trading among the specified countries is 433.2 USD (2005)/tC. Domestic
carbon prices in Japan decrease from 497.5 to 432.8 USD (2005)/tC and in Korea
decrease from 482.4 to 435.9 USD (2005)/tC. China decreases its domestic carbon
price from 420.5 to 403.6 USD (2005)/tC, considering revenue from carbon credit
sales. The domestic abatement cost will increase in China due to the consequent
reduction in additional carbon for trading. However, the cost is partly compensated
by the revenue from selling carbon credits, and the improved “cleaner” environment
produced by additional carbon abatement is also valuable. Similar analysis can be
seen in den Elzen et al. (2011), in which the international carbon price under full
emissions trading is 132 USD in 2005/tC. All countries in the trading community
benefit from selling or buying carbon credits, because sellers can gain revenue from
higher international carbon prices (relative to domestic prices), and buyers can lower
their abatement cost through lower international carbon prices (relative to domestic
prices). Our results reveal a relatively large carbon price for China when attaining its
NDC target, which implies that it will be costly for China to reduce carbon intensity
by 65% in 2030 compared to 2005 levels.
MAC curves for the carbon trading scenario in China, Japan, and Korea in 2030
are given in Figs. 14.4, 14.5, and 14.6. The trading cost or revenue is not included;
the MAC curves show the domestic marginal abatement costs under carbon trading.
China raises its average MAC to produce additional carbon emissions for sale.
However, the revenue from selling carbon credits will decrease the average MAC
from 420.5 to 403.6 USD (2005)/tC. The most significant change is energy saving,
Fig. 14.3 Carbon abatement and trading prices for China, Japan, and Korea in 2030, under
emissions reduction (TAR) and emissions trading (TRD) scenarios
14 Achievement of Nationally Determined Contributions (NDCs) Through Emissions. . .
267