

stations, 31.9% are in residential areas, 5.8% are in commercial areas, and 2.4% are
near schools and hospitals.
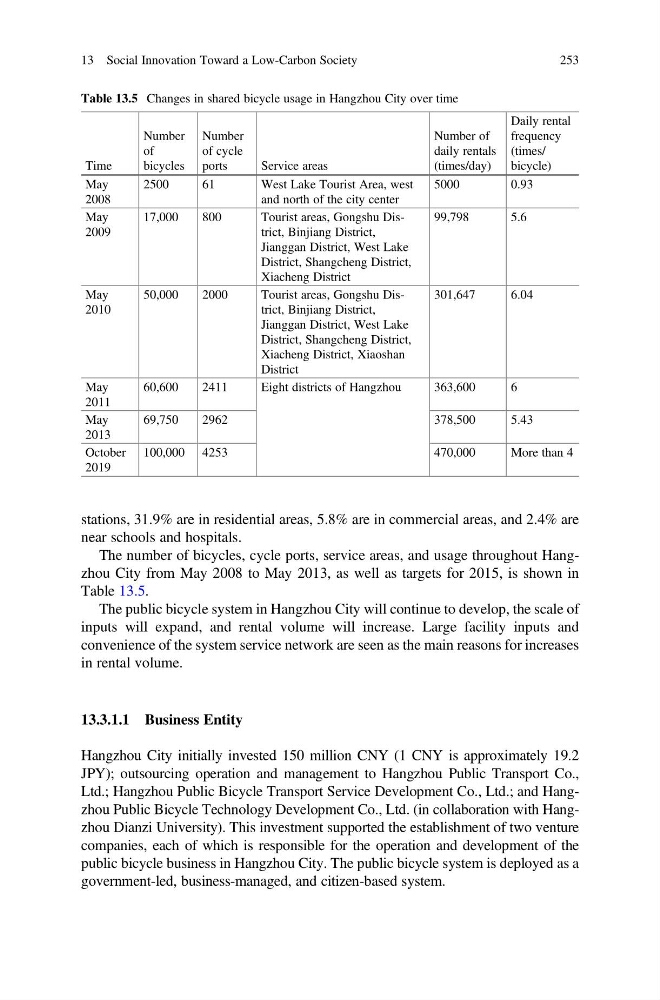
The number of bicycles, cycle ports, service areas, and usage throughout Hangzhou City from May 2008 to May 2013, as well as targets for 2015, is shown in
Table 13.5.
The public bicycle system in Hangzhou City will continue to develop, the scale of
inputs will expand, and rental volume will increase. Large facility inputs and
convenience of the system service network are seen as the main reasons for increases
in rental volume.
13.3.1.1 Business Entity
Hangzhou City initially invested 150 million CNY (1 CNY is approximately 19.2
JPY); outsourcing operation and management to Hangzhou Public Transport Co.,
Ltd.; Hangzhou Public Bicycle Transport Service Development Co., Ltd.; and Hangzhou Public Bicycle Technology Development Co., Ltd. (in collaboration with Hangzhou Dianzi University). This investment supported the establishment of two venture
companies, each of which is responsible for the operation and development of the
public bicycle business in Hangzhou City. The public bicycle system is deployed as a
government-led, business-managed, and citizen-based system.
Table 13.5 Changes in shared bicycle usage in Hangzhou City over time
Time
Number
of
bicycles
Number
of cycle
ports
Service areas
Number of
daily rentals
(times/day)
Daily rental
frequency
(times/
bicycle)
May
2008
2500
61
West Lake Tourist Area, west
and north of the city center
5000
0.93
May
2009
17,000
800
Tourist areas, Gongshu District, Binjiang District,
Jianggan District, West Lake
District, Shangcheng District,
Xiacheng District
99,798
5.6
May
2010
50,000
2000
Tourist areas, Gongshu District, Binjiang District,
Jianggan District, West Lake
District, Shangcheng District,
Xiacheng District, Xiaoshan
District
301,647
6.04
May
2011
60,600
2411
Eight districts of Hangzhou
363,600
6
May
2013
69,750
2962
378,500
5.43
October
2019
100,000 4253
470,000
More than 4
13 Social Innovation Toward a Low-Carbon Society
253
near schools and hospitals.
The number of bicycles, cycle ports, service areas, and usage throughout Hangzhou City from May 2008 to May 2013, as well as targets for 2015, is shown in
Table 13.5.
The public bicycle system in Hangzhou City will continue to develop, the scale of
inputs will expand, and rental volume will increase. Large facility inputs and
convenience of the system service network are seen as the main reasons for increases
in rental volume.
13.3.1.1 Business Entity
Hangzhou City initially invested 150 million CNY (1 CNY is approximately 19.2
JPY); outsourcing operation and management to Hangzhou Public Transport Co.,
Ltd.; Hangzhou Public Bicycle Transport Service Development Co., Ltd.; and Hangzhou Public Bicycle Technology Development Co., Ltd. (in collaboration with Hangzhou Dianzi University). This investment supported the establishment of two venture
companies, each of which is responsible for the operation and development of the
public bicycle business in Hangzhou City. The public bicycle system is deployed as a
government-led, business-managed, and citizen-based system.
Table 13.5 Changes in shared bicycle usage in Hangzhou City over time
Time
Number
of
bicycles
Number
of cycle
ports
Service areas
Number of
daily rentals
(times/day)
Daily rental
frequency
(times/
bicycle)
May
2008
2500
61
West Lake Tourist Area, west
and north of the city center
5000
0.93
May
2009
17,000
800
Tourist areas, Gongshu District, Binjiang District,
Jianggan District, West Lake
District, Shangcheng District,
Xiacheng District
99,798
5.6
May
2010
50,000
2000
Tourist areas, Gongshu District, Binjiang District,
Jianggan District, West Lake
District, Shangcheng District,
Xiacheng District, Xiaoshan
District
301,647
6.04
May
2011
60,600
2411
Eight districts of Hangzhou
363,600
6
May
2013
69,750
2962
378,500
5.43
October
2019
100,000 4253
470,000
More than 4
13 Social Innovation Toward a Low-Carbon Society
253