

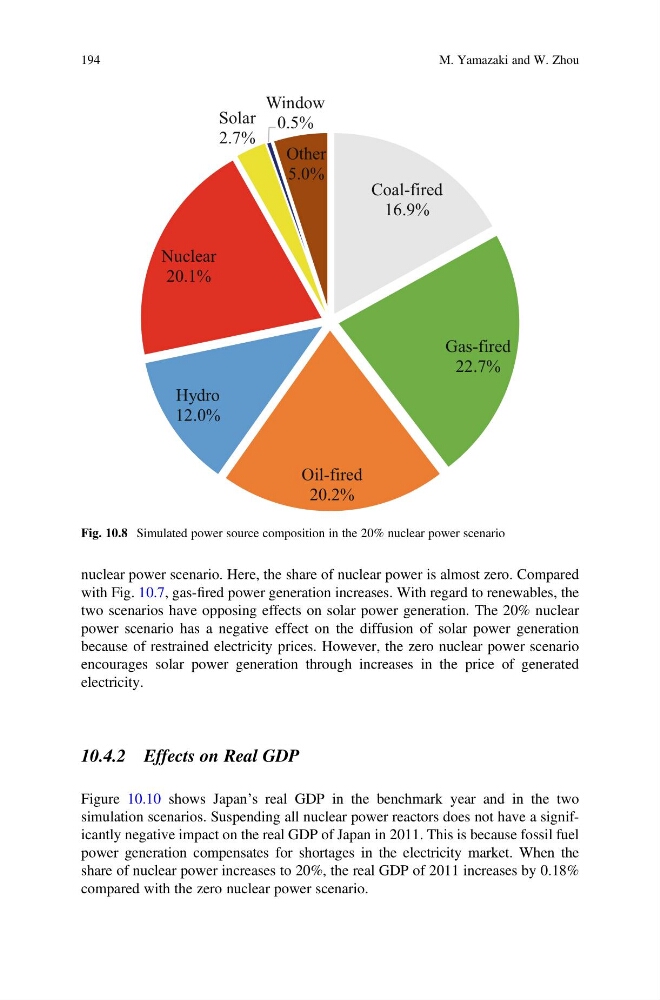
nuclear power scenario. Here, the share of nuclear power is almost zero. Compared
with Fig. 10.7, gas-fired power generation increases. With regard to renewables, the
two scenarios have opposing effects on solar power generation. The 20% nuclear
power scenario has a negative effect on the diffusion of solar power generation
because of restrained electricity prices. However, the zero nuclear power scenario
encourages solar power generation through increases in the price of generated
electricity.
10.4.2 Effects on Real GDP
Figure 10.10 shows Japan’s real GDP in the benchmark year and in the two
simulation scenarios. Suspending all nuclear power reactors does not have a significantly negative impact on the real GDP of Japan in 2011. This is because fossil fuel
power generation compensates for shortages in the electricity market. When the
share of nuclear power increases to 20%, the real GDP of 2011 increases by 0.18%
compared with the zero nuclear power scenario.
Coal-fired
16.9%
Gas-fired
22.7%
Oil-fired
20.2%
Hydro
12.0%
Nuclear
20.1%
Solar
2.7%
Window
0.5%
Other
5.0%
Fig. 10.8 Simulated power source composition in the 20% nuclear power scenario
194
M. Yamazaki and W. Zhou
with Fig. 10.7, gas-fired power generation increases. With regard to renewables, the
two scenarios have opposing effects on solar power generation. The 20% nuclear
power scenario has a negative effect on the diffusion of solar power generation
because of restrained electricity prices. However, the zero nuclear power scenario
encourages solar power generation through increases in the price of generated
electricity.
10.4.2 Effects on Real GDP
Figure 10.10 shows Japan’s real GDP in the benchmark year and in the two
simulation scenarios. Suspending all nuclear power reactors does not have a significantly negative impact on the real GDP of Japan in 2011. This is because fossil fuel
power generation compensates for shortages in the electricity market. When the
share of nuclear power increases to 20%, the real GDP of 2011 increases by 0.18%
compared with the zero nuclear power scenario.
Coal-fired
16.9%
Gas-fired
22.7%
Oil-fired
20.2%
Hydro
12.0%
Nuclear
20.1%
Solar
2.7%
Window
0.5%
Other
5.0%
Fig. 10.8 Simulated power source composition in the 20% nuclear power scenario
194
M. Yamazaki and W. Zhou