

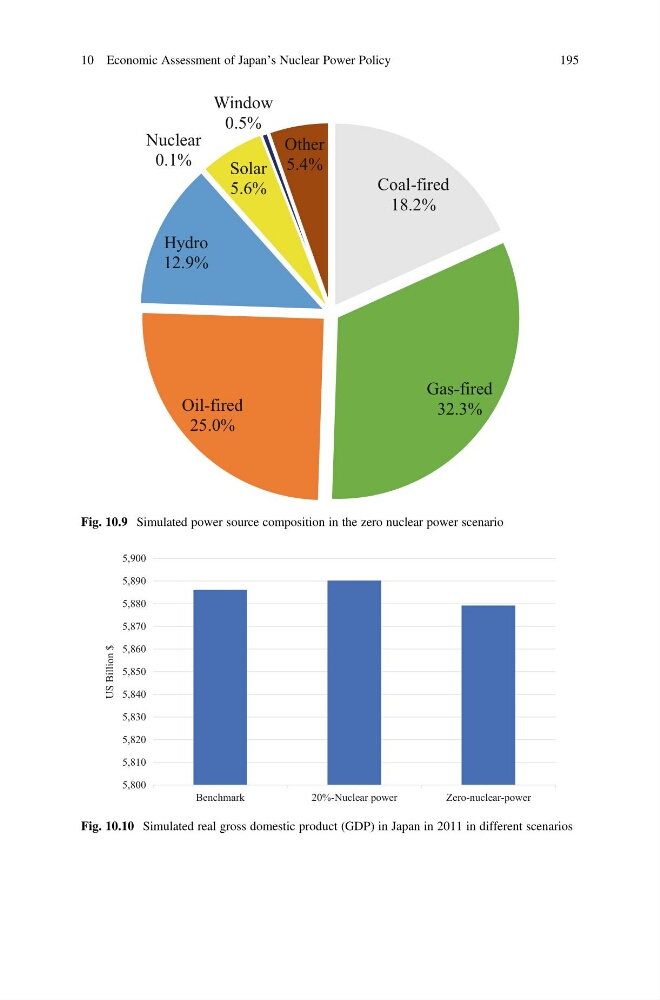
Coal-fired
18.2%
Gas-fired
32.3%
Oil-fired
25.0%
Hydro
12.9%
Nuclear
0.1%
Solar
5.6%
Window
0.5%
Other
5.4%
Fig. 10.9 Simulated power source composition in the zero nuclear power scenario
5,800
5,810
5,820
5,830
5,840
5,850
5,860
5,870
5,880
5,890
5,900
Benchmark
20%-Nuclear power
Zero-nuclear-power
US Billion $
Fig. 10.10 Simulated real gross domestic product (GDP) in Japan in 2011 in different scenarios
10 Economic Assessment of Japan’s Nuclear Power Policy
195
18.2%
Gas-fired
32.3%
Oil-fired
25.0%
Hydro
12.9%
Nuclear
0.1%
Solar
5.6%
Window
0.5%
Other
5.4%
Fig. 10.9 Simulated power source composition in the zero nuclear power scenario
5,800
5,810
5,820
5,830
5,840
5,850
5,860
5,870
5,880
5,890
5,900
Benchmark
20%-Nuclear power
Zero-nuclear-power
US Billion $
Fig. 10.10 Simulated real gross domestic product (GDP) in Japan in 2011 in different scenarios
10 Economic Assessment of Japan’s Nuclear Power Policy
195