

generation in Japan. The second scenario is called the zero nuclear power scenario.
Simulations of these two scenarios are compared, and the importance of nuclear
power generation in Japan is assessed. In both scenarios, FIT is introduced as a 20%
ad valorem subsidy for renewables.
10.4 Simulation Results
10.4.1 Power Source Composition
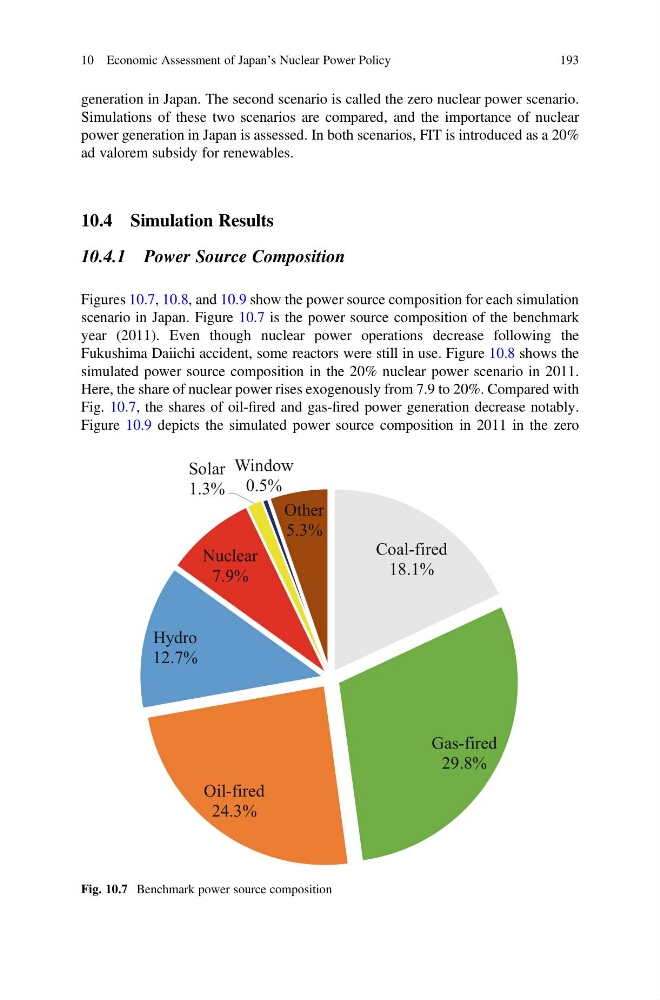
Figures 10.7, 10.8, and 10.9 show the power source composition for each simulation
scenario in Japan. Figure 10.7 is the power source composition of the benchmark
year (2011). Even though nuclear power operations decrease following the
Fukushima Daiichi accident, some reactors were still in use. Figure 10.8 shows the
simulated power source composition in the 20% nuclear power scenario in 2011.
Here, the share of nuclear power rises exogenously from 7.9 to 20%. Compared with
Fig. 10.7, the shares of oil-fired and gas-fired power generation decrease notably.
Figure 10.9 depicts the simulated power source composition in 2011 in the zero
Coal-fired
18.1%
Gas-fired
29.8%
Oil-fired
24.3%
Hydro
12.7%
Nuclear
7.9%
Solar
1.3%
Window
0.5%
Other
5.3%
Fig. 10.7 Benchmark power source composition
10 Economic Assessment of Japan’s Nuclear Power Policy
193
Simulations of these two scenarios are compared, and the importance of nuclear
power generation in Japan is assessed. In both scenarios, FIT is introduced as a 20%
ad valorem subsidy for renewables.
10.4 Simulation Results
10.4.1 Power Source Composition
Figures 10.7, 10.8, and 10.9 show the power source composition for each simulation
scenario in Japan. Figure 10.7 is the power source composition of the benchmark
year (2011). Even though nuclear power operations decrease following the
Fukushima Daiichi accident, some reactors were still in use. Figure 10.8 shows the
simulated power source composition in the 20% nuclear power scenario in 2011.
Here, the share of nuclear power rises exogenously from 7.9 to 20%. Compared with
Fig. 10.7, the shares of oil-fired and gas-fired power generation decrease notably.
Figure 10.9 depicts the simulated power source composition in 2011 in the zero
Coal-fired
18.1%
Gas-fired
29.8%
Oil-fired
24.3%
Hydro
12.7%
Nuclear
7.9%
Solar
1.3%
Window
0.5%
Other
5.3%
Fig. 10.7 Benchmark power source composition
10 Economic Assessment of Japan’s Nuclear Power Policy
193