

9.2.2 Wind Power Generation
Wind power generation uses air flow through a wind turbine to mechanically power
a generator to generate electricity. Its energy conversion efficiency is given in the
following equation:
η ¼ η t  η m  η e
ð9:4Þ
where η t is turbine efficiency, η m is mechanical efficiency, and η e is electrical
efficiency. Then, electricity generation is given in the following equation:
P out ¼ P in  η
ð9:5Þ
where P in ¼ 0.5ρAV
3 is the total wind power flowing into the wind inlet of the wind
turbine, ρ is air density, A is the wind blade swept area, and V is wind velocity.
The maximum efficiency of a wind turbine, known as the Betz limit, is 59.26%
(Blackwood 2016). Based on this efficiency, the potential of wind power generation
in China, Japan, and South Korea is given in Table 9.2. The potential supply of wind
power generation is defined by the following equation:
Wind power generation potential supply
¼
Potential of the electricity production
Total electricity consumption in 2017
 100%
ð9:6Þ
The potential supply of wind power generation based on total electricity consumption in 2017 is 495% in China, 209% in Japan, and 130% in South Korea.
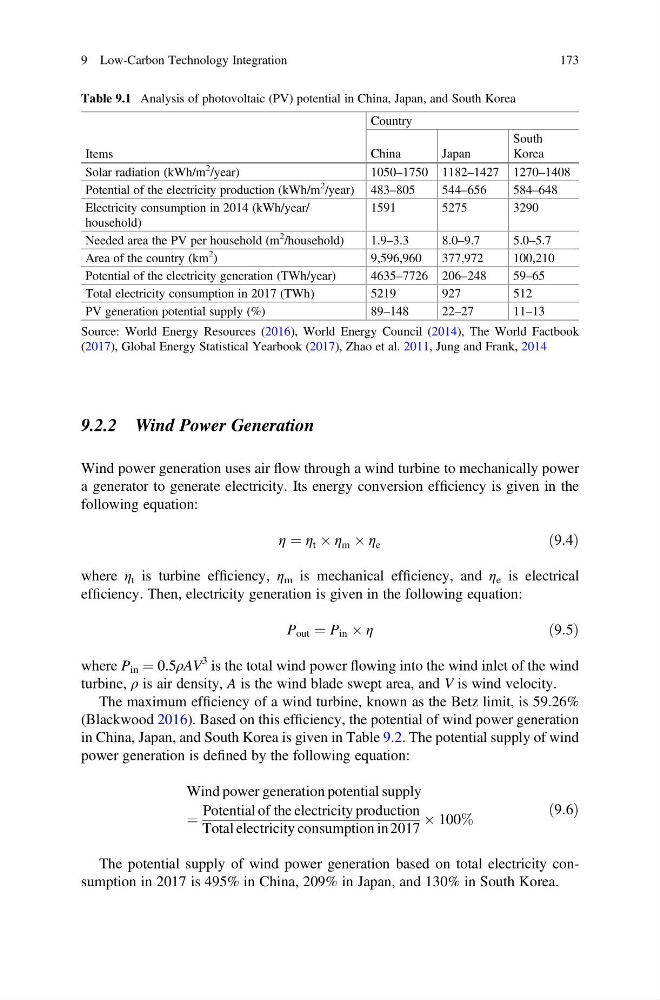
Table 9.1 Analysis of photovoltaic (PV) potential in China, Japan, and South Korea
Items
Country
China
Japan
South
Korea
Solar radiation (kWh/m
2
/year)
1050–1750 1182–1427 1270–1408
Potential of the electricity production (kWh/m
2
/year) 483–805
544–656
584–648
Electricity consumption in 2014 (kWh/year/
household)
1591
5275
3290
Needed area the PV per household (m
2
/household)
1.9–3.3
8.0–9.7
5.0–5.7
Area of the country (km
2
)
9,596,960
377,972
100,210
Potential of the electricity generation (TWh/year)
4635–7726 206–248
59–65
Total electricity consumption in 2017 (TWh)
5219
927
512
PV generation potential supply (%)
89–148
22–27
11–13
Source: World Energy Resources (2016), World Energy Council (2014), The World Factbook
(2017), Global Energy Statistical Yearbook (2017), Zhao et al. 2011, Jung and Frank, 2014
9 Low-Carbon Technology Integration
173
Wind power generation uses air flow through a wind turbine to mechanically power
a generator to generate electricity. Its energy conversion efficiency is given in the
following equation:
η ¼ η t  η m  η e
ð9:4Þ
where η t is turbine efficiency, η m is mechanical efficiency, and η e is electrical
efficiency. Then, electricity generation is given in the following equation:
P out ¼ P in  η
ð9:5Þ
where P in ¼ 0.5ρAV
3 is the total wind power flowing into the wind inlet of the wind
turbine, ρ is air density, A is the wind blade swept area, and V is wind velocity.
The maximum efficiency of a wind turbine, known as the Betz limit, is 59.26%
(Blackwood 2016). Based on this efficiency, the potential of wind power generation
in China, Japan, and South Korea is given in Table 9.2. The potential supply of wind
power generation is defined by the following equation:
Wind power generation potential supply
¼
Potential of the electricity production
Total electricity consumption in 2017
 100%
ð9:6Þ
The potential supply of wind power generation based on total electricity consumption in 2017 is 495% in China, 209% in Japan, and 130% in South Korea.
Table 9.1 Analysis of photovoltaic (PV) potential in China, Japan, and South Korea
Items
Country
China
Japan
South
Korea
Solar radiation (kWh/m
2
/year)
1050–1750 1182–1427 1270–1408
Potential of the electricity production (kWh/m
2
/year) 483–805
544–656
584–648
Electricity consumption in 2014 (kWh/year/
household)
1591
5275
3290
Needed area the PV per household (m
2
/household)
1.9–3.3
8.0–9.7
5.0–5.7
Area of the country (km
2
)
9,596,960
377,972
100,210
Potential of the electricity generation (TWh/year)
4635–7726 206–248
59–65
Total electricity consumption in 2017 (TWh)
5219
927
512
PV generation potential supply (%)
89–148
22–27
11–13
Source: World Energy Resources (2016), World Energy Council (2014), The World Factbook
(2017), Global Energy Statistical Yearbook (2017), Zhao et al. 2011, Jung and Frank, 2014
9 Low-Carbon Technology Integration
173