

182
9 Molecular Flexibility and Material Properties
c
c
c
a)
b)
c)
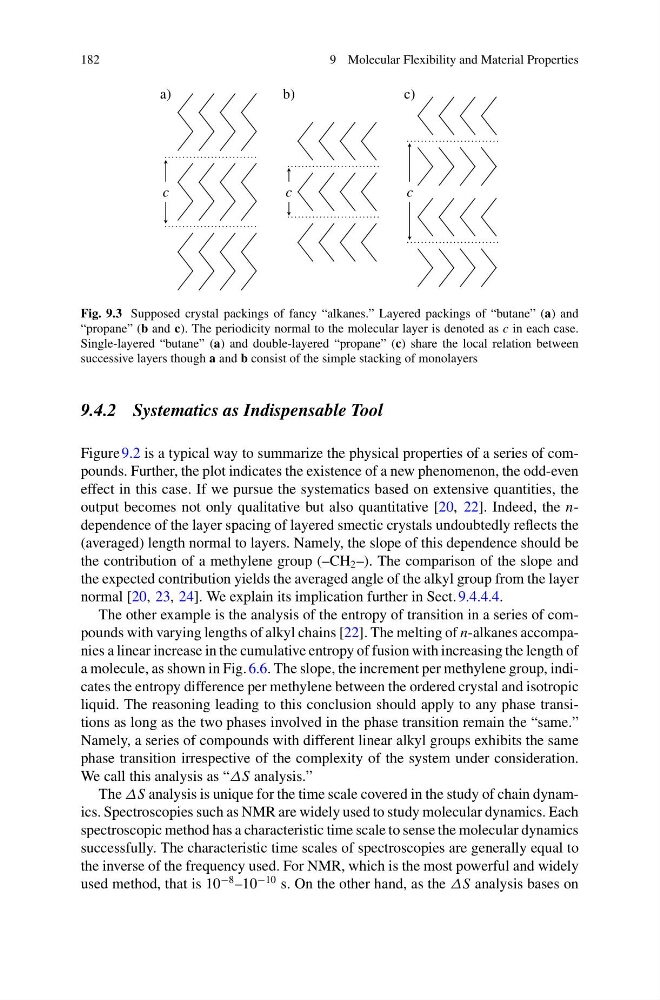
Fig. 9.3 Supposed crystal packings of fancy “alkanes.” Layered packings of “butane” (a) and
“propane” (b and c). The periodicity normal to the molecular layer is denoted as c in each case.
Single-layered “butane” (a) and double-layered “propane” (c) share the local relation between
successive layers though a and b consist of the simple stacking of monolayers
9.4.2 Systematics as Indispensable Tool
Figure 9.2 is a typical way to summarize the physical properties of a series of compounds. Further, the plot indicates the existence of a new phenomenon, the odd-even
effect in this case. If we pursue the systematics based on extensive quantities, the
output becomes not only qualitative but also quantitative [20, 22]. Indeed, the ndependence of the layer spacing of layered smectic crystals undoubtedly reflects the
(averaged) length normal to layers. Namely, the slope of this dependence should be
the contribution of a methylene group (–CH 2 –). The comparison of the slope and
the expected contribution yields the averaged angle of the alkyl group from the layer
normal [20, 23, 24]. We explain its implication further in Sect. 9.4.4.4.
The other example is the analysis of the entropy of transition in a series of compounds with varying lengths of alkyl chains [22]. The melting of n-alkanes accompanies a linear increase in the cumulative entropy of fusion with increasing the length of
a molecule, as shown in Fig. 6.6. The slope, the increment per methylene group, indicates the entropy difference per methylene between the ordered crystal and isotropic
liquid. The reasoning leading to this conclusion should apply to any phase transitions as long as the two phases involved in the phase transition remain the “same.”
Namely, a series of compounds with different linear alkyl groups exhibits the same
phase transition irrespective of the complexity of the system under consideration.
We call this analysis as “ΔS analysis.”
The ΔS analysis is unique for the time scale covered in the study of chain dynamics. Spectroscopies such as NMR are widely used to study molecular dynamics. Each
spectroscopic method has a characteristic time scale to sense the molecular dynamics
successfully. The characteristic time scales of spectroscopies are generally equal to
the inverse of the frequency used. For NMR, which is the most powerful and widely
used method, that is 10
−8 –10
−10 s. On the other hand, as the ΔS analysis bases on
9 Molecular Flexibility and Material Properties
c
c
c
a)
b)
c)
Fig. 9.3 Supposed crystal packings of fancy “alkanes.” Layered packings of “butane” (a) and
“propane” (b and c). The periodicity normal to the molecular layer is denoted as c in each case.
Single-layered “butane” (a) and double-layered “propane” (c) share the local relation between
successive layers though a and b consist of the simple stacking of monolayers
9.4.2 Systematics as Indispensable Tool
Figure 9.2 is a typical way to summarize the physical properties of a series of compounds. Further, the plot indicates the existence of a new phenomenon, the odd-even
effect in this case. If we pursue the systematics based on extensive quantities, the
output becomes not only qualitative but also quantitative [20, 22]. Indeed, the ndependence of the layer spacing of layered smectic crystals undoubtedly reflects the
(averaged) length normal to layers. Namely, the slope of this dependence should be
the contribution of a methylene group (–CH 2 –). The comparison of the slope and
the expected contribution yields the averaged angle of the alkyl group from the layer
normal [20, 23, 24]. We explain its implication further in Sect. 9.4.4.4.
The other example is the analysis of the entropy of transition in a series of compounds with varying lengths of alkyl chains [22]. The melting of n-alkanes accompanies a linear increase in the cumulative entropy of fusion with increasing the length of
a molecule, as shown in Fig. 6.6. The slope, the increment per methylene group, indicates the entropy difference per methylene between the ordered crystal and isotropic
liquid. The reasoning leading to this conclusion should apply to any phase transitions as long as the two phases involved in the phase transition remain the “same.”
Namely, a series of compounds with different linear alkyl groups exhibits the same
phase transition irrespective of the complexity of the system under consideration.
We call this analysis as “ΔS analysis.”
The ΔS analysis is unique for the time scale covered in the study of chain dynamics. Spectroscopies such as NMR are widely used to study molecular dynamics. Each
spectroscopic method has a characteristic time scale to sense the molecular dynamics
successfully. The characteristic time scales of spectroscopies are generally equal to
the inverse of the frequency used. For NMR, which is the most powerful and widely
used method, that is 10
−8 –10
−10 s. On the other hand, as the ΔS analysis bases on