

170
8 Molecular Glasses
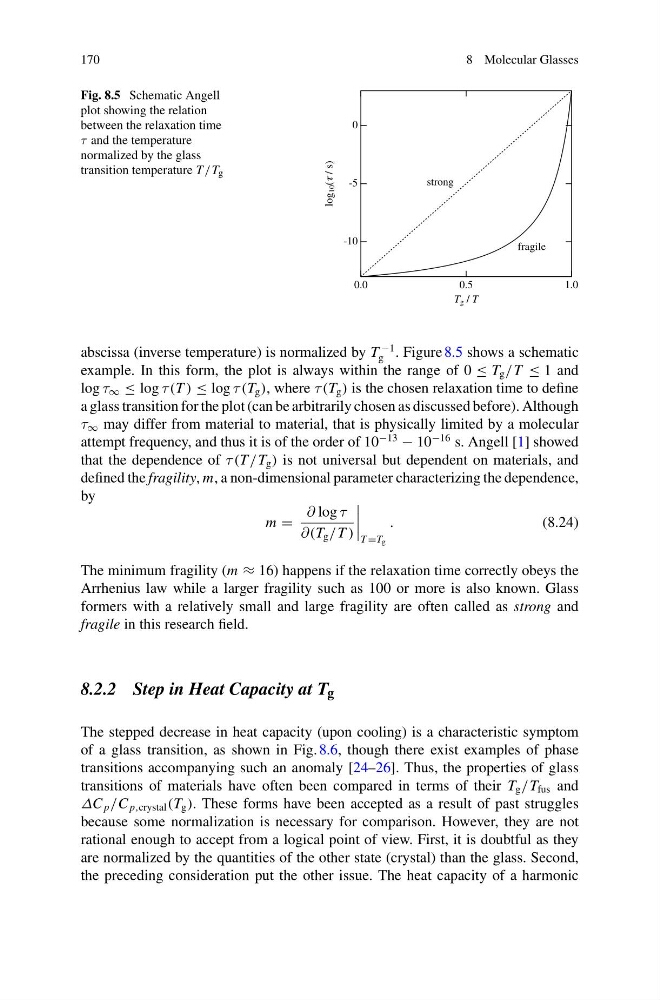
Fig. 8.5 Schematic Angell
plot showing the relation
between the relaxation time
τ and the temperature
normalized by the glass
transition temperature T /T g
-10
-5
0
log
10 (
/ s)
1.0
0.5
0.0
T g / T
strong
fragile
abscissa (inverse temperature) is normalized by T
−1
g . Figure 8.5 shows a schematic
example. In this form, the plot is always within the range of 0 ≤ T g /T ≤ 1 and
log τ ∞ ≤ log τ (T ) ≤ log τ (T g ), where τ (T g ) is the chosen relaxation time to define
a glass transition for the plot (can be arbitrarily chosen as discussed before). Although
τ ∞ may differ from material to material, that is physically limited by a molecular
attempt frequency, and thus it is of the order of 10
−13
− 10
−16 s. Angell [1] showed
that the dependence of τ (T /T g ) is not universal but dependent on materials, and
defined the fragility, m, a non-dimensional parameter characterizing the dependence,
by
m =
∂ log τ
∂(T g /T )
T =T g
.
(8.24)
The minimum fragility (m ≈ 16) happens if the relaxation time correctly obeys the
Arrhenius law while a larger fragility such as 100 or more is also known. Glass
formers with a relatively small and large fragility are often called as strong and
fragile in this research field.
8.2.2 Step in Heat Capacity at T g
The stepped decrease in heat capacity (upon cooling) is a characteristic symptom
of a glass transition, as shown in Fig. 8.6, though there exist examples of phase
transitions accompanying such an anomaly [24–26]. Thus, the properties of glass
transitions of materials have often been compared in terms of their T g /T fus and
ΔC p /C p,crystal (T g ). These forms have been accepted as a result of past struggles
because some normalization is necessary for comparison. However, they are not
rational enough to accept from a logical point of view. First, it is doubtful as they
are normalized by the quantities of the other state (crystal) than the glass. Second,
the preceding consideration put the other issue. The heat capacity of a harmonic
8 Molecular Glasses
Fig. 8.5 Schematic Angell
plot showing the relation
between the relaxation time
τ and the temperature
normalized by the glass
transition temperature T /T g
-10
-5
0
log
10 (
/ s)
1.0
0.5
0.0
T g / T
strong
fragile
abscissa (inverse temperature) is normalized by T
−1
g . Figure 8.5 shows a schematic
example. In this form, the plot is always within the range of 0 ≤ T g /T ≤ 1 and
log τ ∞ ≤ log τ (T ) ≤ log τ (T g ), where τ (T g ) is the chosen relaxation time to define
a glass transition for the plot (can be arbitrarily chosen as discussed before). Although
τ ∞ may differ from material to material, that is physically limited by a molecular
attempt frequency, and thus it is of the order of 10
−13
− 10
−16 s. Angell [1] showed
that the dependence of τ (T /T g ) is not universal but dependent on materials, and
defined the fragility, m, a non-dimensional parameter characterizing the dependence,
by
m =
∂ log τ
∂(T g /T )
T =T g
.
(8.24)
The minimum fragility (m ≈ 16) happens if the relaxation time correctly obeys the
Arrhenius law while a larger fragility such as 100 or more is also known. Glass
formers with a relatively small and large fragility are often called as strong and
fragile in this research field.
8.2.2 Step in Heat Capacity at T g
The stepped decrease in heat capacity (upon cooling) is a characteristic symptom
of a glass transition, as shown in Fig. 8.6, though there exist examples of phase
transitions accompanying such an anomaly [24–26]. Thus, the properties of glass
transitions of materials have often been compared in terms of their T g /T fus and
ΔC p /C p,crystal (T g ). These forms have been accepted as a result of past struggles
because some normalization is necessary for comparison. However, they are not
rational enough to accept from a logical point of view. First, it is doubtful as they
are normalized by the quantities of the other state (crystal) than the glass. Second,
the preceding consideration put the other issue. The heat capacity of a harmonic