

Suitable WQIs should have clear objectives, good synthetic capacities, and be
able to achieve a reasonable balance between the simplification of reality and the
complexity of the environment. They should include variables that are normally and
continuously monitored and that have a clear effect on water quality (e.g., potentially
affecting aquatic life, bathing, public supply, irrigation, and recreational uses). WQI
is most useful for comparative purposes and for general questions. Site-specific
questions that should be addressed by an analysis of the original data. It is limited
in that while a certain site may receive a good score, it may still be impaired or
degraded based on a parameter not included in the index calculation. Also, aggregation of data may either mask or over-emphasize short-term (acute) water quality
problems. Table 3.4 summarizes developments and practical WQIs’ applications.
The WQIs summarized below are a version of a WQI that was adapted from work
conducted by the National Sanitation Foundation (NSF) in the 1970s. Concentrations of nine parameters (dissolved oxygen, fecal coliform, pH, biochemical oxygen
demand (BOD), total nitrates and phosphates, total solids, temperature, and turbidity) were each assigned an individual rating based on existing standards or best
professional judgment on a scale of 0–100. Each rating was then multiplied and the
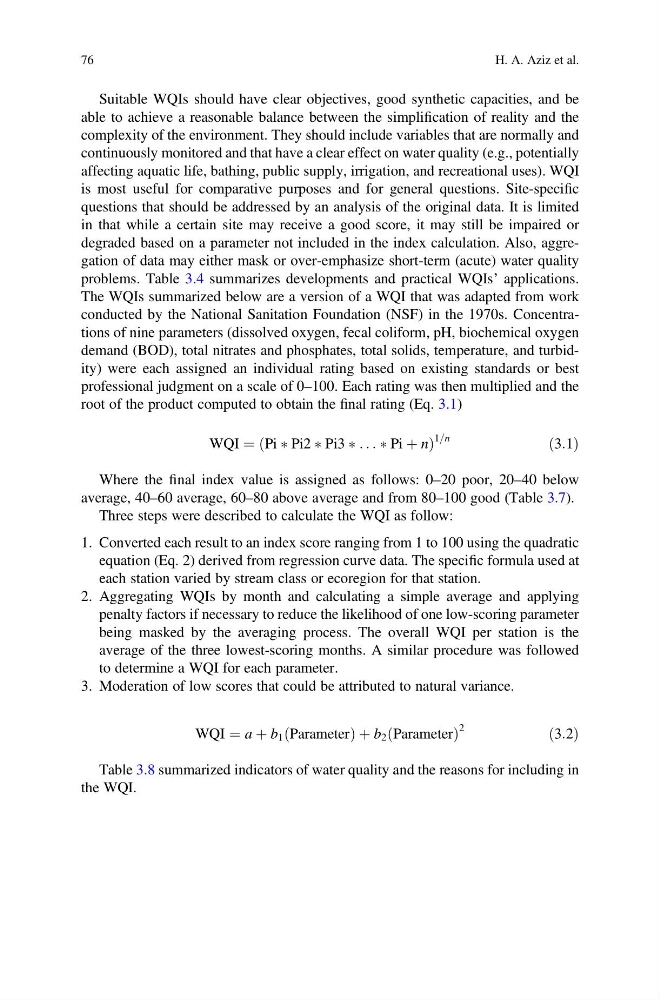
root of the product computed to obtain the final rating (Eq. 3.1)
WQI ¼ Pi à Pi2 à Pi3 à . . . à Pi þ n
ð
Þ
1=n
ð3:1Þ
Where the final index value is assigned as follows: 0–20 poor, 20–40 below
average, 40–60 average, 60–80 above average and from 80–100 good (Table 3.7).
Three steps were described to calculate the WQI as follow:
1. Converted each result to an index score ranging from 1 to 100 using the quadratic
equation (Eq. 2) derived from regression curve data. The specific formula used at
each station varied by stream class or ecoregion for that station.
2. Aggregating WQIs by month and calculating a simple average and applying
penalty factors if necessary to reduce the likelihood of one low-scoring parameter
being masked by the averaging process. The overall WQI per station is the
average of the three lowest-scoring months. A similar procedure was followed
to determine a WQI for each parameter.
3. Moderation of low scores that could be attributed to natural variance.
WQI ¼ a þ b 1 Parameter
ð
Þþb 2 Parameter
ð
Þ
2
ð3:2Þ
Table 3.8 summarized indicators of water quality and the reasons for including in
the WQI.
76
H. A. Aziz et al.
able to achieve a reasonable balance between the simplification of reality and the
complexity of the environment. They should include variables that are normally and
continuously monitored and that have a clear effect on water quality (e.g., potentially
affecting aquatic life, bathing, public supply, irrigation, and recreational uses). WQI
is most useful for comparative purposes and for general questions. Site-specific
questions that should be addressed by an analysis of the original data. It is limited
in that while a certain site may receive a good score, it may still be impaired or
degraded based on a parameter not included in the index calculation. Also, aggregation of data may either mask or over-emphasize short-term (acute) water quality
problems. Table 3.4 summarizes developments and practical WQIs’ applications.
The WQIs summarized below are a version of a WQI that was adapted from work
conducted by the National Sanitation Foundation (NSF) in the 1970s. Concentrations of nine parameters (dissolved oxygen, fecal coliform, pH, biochemical oxygen
demand (BOD), total nitrates and phosphates, total solids, temperature, and turbidity) were each assigned an individual rating based on existing standards or best
professional judgment on a scale of 0–100. Each rating was then multiplied and the
root of the product computed to obtain the final rating (Eq. 3.1)
WQI ¼ Pi à Pi2 à Pi3 à . . . à Pi þ n
ð
Þ
1=n
ð3:1Þ
Where the final index value is assigned as follows: 0–20 poor, 20–40 below
average, 40–60 average, 60–80 above average and from 80–100 good (Table 3.7).
Three steps were described to calculate the WQI as follow:
1. Converted each result to an index score ranging from 1 to 100 using the quadratic
equation (Eq. 2) derived from regression curve data. The specific formula used at
each station varied by stream class or ecoregion for that station.
2. Aggregating WQIs by month and calculating a simple average and applying
penalty factors if necessary to reduce the likelihood of one low-scoring parameter
being masked by the averaging process. The overall WQI per station is the
average of the three lowest-scoring months. A similar procedure was followed
to determine a WQI for each parameter.
3. Moderation of low scores that could be attributed to natural variance.
WQI ¼ a þ b 1 Parameter
ð
Þþb 2 Parameter
ð
Þ
2
ð3:2Þ
Table 3.8 summarized indicators of water quality and the reasons for including in
the WQI.
76
H. A. Aziz et al.