

been designed for hysic-chemical parameters. The development of a WQI is normally through different steps [18–20] and are as follows:
1. Selection of the optimum set of parameters that together reflect the overall quality
of the water body with respect to a given end use
2. Transformation of the required parameters of different units and dimensions into
a common scale based on their impact on the health and ecosystem
3. Determination of weights of selected parameters
4. Calculation of the index score is obtained by aggregating the respective
sub-indices into a common function
Table 3.6 Physico-chemical quality elements monitored for each water category [9]
Quality element
Rivers
Lakes
TraC
pH
✓
✓
Ammonia (total as N)
✓
✓
Phosphate
✓
✓
Dissolved inorganic nitrogen
✓
Dissolved oxygen
✓
✓
✓
Specific pollutants (annex VIII)
✓
✓
✓
Acid neutralizing capacity
✓
Temperature
✓
Do the estimated values
for the biological quality
elements meet
reference conditions?
Do the physicochemical
conditions meet
high status?
Do the hydromorphological
conditions meet high
status?
Classify
as high
status
Classify
as good
status
Classify as
moderate
status
Classify
as poor
status
Classify
as bad
status
Is the deviation
severe?
Is the deviation
major?
Is the deviation of the
values for the
biological quality
elements moderate or
less?
Do the physicochemical conditions (3)
ensure ecosystem
functioning and (b)
meet the EQSe for
specific pollutants?
Do the estimated values
for the biological quality
elements deviate only
slightly from reference
condition values?
Yes
Yes
Yes
Yes
Yes
Yes
No
No
No
No
Yes
Yes
No
No
No
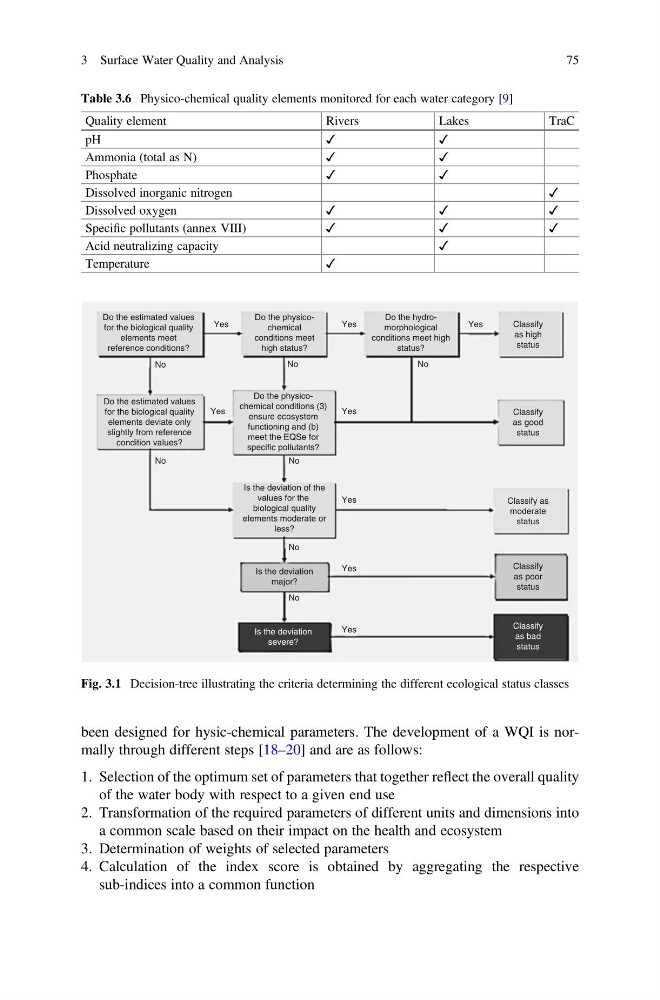
Fig. 3.1 Decision-tree illustrating the criteria determining the different ecological status classes
3 Surface Water Quality and Analysis
75
1. Selection of the optimum set of parameters that together reflect the overall quality
of the water body with respect to a given end use
2. Transformation of the required parameters of different units and dimensions into
a common scale based on their impact on the health and ecosystem
3. Determination of weights of selected parameters
4. Calculation of the index score is obtained by aggregating the respective
sub-indices into a common function
Table 3.6 Physico-chemical quality elements monitored for each water category [9]
Quality element
Rivers
Lakes
TraC
pH
✓
✓
Ammonia (total as N)
✓
✓
Phosphate
✓
✓
Dissolved inorganic nitrogen
✓
Dissolved oxygen
✓
✓
✓
Specific pollutants (annex VIII)
✓
✓
✓
Acid neutralizing capacity
✓
Temperature
✓
Do the estimated values
for the biological quality
elements meet
reference conditions?
Do the physicochemical
conditions meet
high status?
Do the hydromorphological
conditions meet high
status?
Classify
as high
status
Classify
as good
status
Classify as
moderate
status
Classify
as poor
status
Classify
as bad
status
Is the deviation
severe?
Is the deviation
major?
Is the deviation of the
values for the
biological quality
elements moderate or
less?
Do the physicochemical conditions (3)
ensure ecosystem
functioning and (b)
meet the EQSe for
specific pollutants?
Do the estimated values
for the biological quality
elements deviate only
slightly from reference
condition values?
Yes
Yes
Yes
Yes
Yes
Yes
No
No
No
No
Yes
Yes
No
No
No
Fig. 3.1 Decision-tree illustrating the criteria determining the different ecological status classes
3 Surface Water Quality and Analysis
75