

Khon Kaen salt-damaged soil (1) was taken from the shore part of the pond, with
finer soil and more water content. Khon Kaen salt-damaged soil (2) was taken from
the farther part of the pond, approximately 10 m apart toward drier land with coarser
soil and less water content. Both samples were taken during the dry season. During
the rainy season, the surfaces of both sampling locations are covered with water.
In Table 11.1, Eqs. (1) and (2) show hydrogen production through the acetic acid
and butyric acid pathways, respectively. Equations. (3), (4), and (5) show the
pathways with no hydrogen production. The equations express the pathways of
propionic acid fermentation, lactic acid, and alcohol fermentation, respectively.
The possible reason for the hydrogen yield being below the theoretical value is
that the low F/M ratio produced conditions that were not optimum for the pathways
expressed by Eqs. (1) and (2). From the comparison of the standard Gibbs energy of
the formation values, it can be assumed that the pathways for propionic acid
fermentation (Eq. (3)) and alcohol fermentation (Eq. (5)) are more spontaneous
than the rest. Thus, they are more likely to occur, as the substrate concentration
was low, the reaction rate was high, and the hydrogen recovery rate was low. The
production of propionate can decrease the production of hydrogen [24–27]. Very
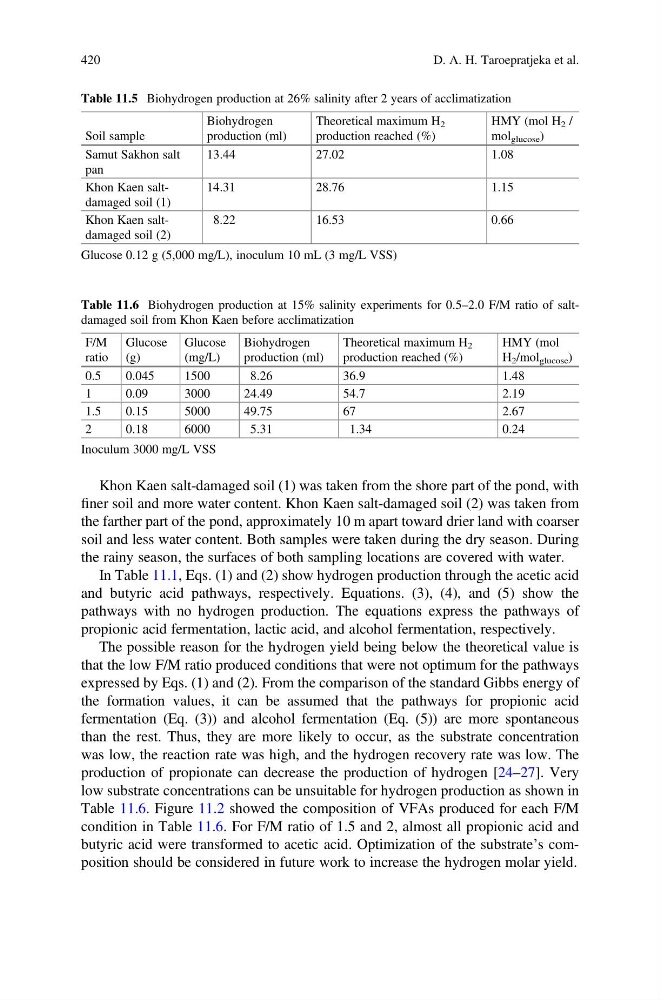
low substrate concentrations can be unsuitable for hydrogen production as shown in
Table 11.6. Figure 11.2 showed the composition of VFAs produced for each F/M
condition in Table 11.6. For F/M ratio of 1.5 and 2, almost all propionic acid and
butyric acid were transformed to acetic acid. Optimization of the substrate’s composition should be considered in future work to increase the hydrogen molar yield.
Table 11.5 Biohydrogen production at 26% salinity after 2 years of acclimatization
Soil sample
Biohydrogen
production (ml)
Theoretical maximum H 2
production reached (%)
HMY (mol H 2 /
mol glucose )
Samut Sakhon salt
pan
13.44
27.02
1.08
Khon Kaen saltdamaged soil (1)
14.31
28.76
1.15
Khon Kaen saltdamaged soil (2)
8.22
16.53
0.66
Glucose 0.12 g (5,000 mg/L), inoculum 10 mL (3 mg/L VSS)
Table 11.6 Biohydrogen production at 15% salinity experiments for 0.5–2.0 F/M ratio of saltdamaged soil from Khon Kaen before acclimatization
F/M
ratio
Glucose
(g)
Glucose
(mg/L)
Biohydrogen
production (ml)
Theoretical maximum H 2
production reached (%)
HMY (mol
H 2 /mol glucose )
0.5
0.045
1500
8.26
36.9
1.48
1
0.09
3000
24.49
54.7
2.19
1.5
0.15
5000
49.75
67
2.67
2
0.18
6000
5.31
1.34
0.24
Inoculum 3000 mg/L VSS
420
D. A. H. Taroepratjeka et al.
finer soil and more water content. Khon Kaen salt-damaged soil (2) was taken from
the farther part of the pond, approximately 10 m apart toward drier land with coarser
soil and less water content. Both samples were taken during the dry season. During
the rainy season, the surfaces of both sampling locations are covered with water.
In Table 11.1, Eqs. (1) and (2) show hydrogen production through the acetic acid
and butyric acid pathways, respectively. Equations. (3), (4), and (5) show the
pathways with no hydrogen production. The equations express the pathways of
propionic acid fermentation, lactic acid, and alcohol fermentation, respectively.
The possible reason for the hydrogen yield being below the theoretical value is
that the low F/M ratio produced conditions that were not optimum for the pathways
expressed by Eqs. (1) and (2). From the comparison of the standard Gibbs energy of
the formation values, it can be assumed that the pathways for propionic acid
fermentation (Eq. (3)) and alcohol fermentation (Eq. (5)) are more spontaneous
than the rest. Thus, they are more likely to occur, as the substrate concentration
was low, the reaction rate was high, and the hydrogen recovery rate was low. The
production of propionate can decrease the production of hydrogen [24–27]. Very
low substrate concentrations can be unsuitable for hydrogen production as shown in
Table 11.6. Figure 11.2 showed the composition of VFAs produced for each F/M
condition in Table 11.6. For F/M ratio of 1.5 and 2, almost all propionic acid and
butyric acid were transformed to acetic acid. Optimization of the substrate’s composition should be considered in future work to increase the hydrogen molar yield.
Table 11.5 Biohydrogen production at 26% salinity after 2 years of acclimatization
Soil sample
Biohydrogen
production (ml)
Theoretical maximum H 2
production reached (%)
HMY (mol H 2 /
mol glucose )
Samut Sakhon salt
pan
13.44
27.02
1.08
Khon Kaen saltdamaged soil (1)
14.31
28.76
1.15
Khon Kaen saltdamaged soil (2)
8.22
16.53
0.66
Glucose 0.12 g (5,000 mg/L), inoculum 10 mL (3 mg/L VSS)
Table 11.6 Biohydrogen production at 15% salinity experiments for 0.5–2.0 F/M ratio of saltdamaged soil from Khon Kaen before acclimatization
F/M
ratio
Glucose
(g)
Glucose
(mg/L)
Biohydrogen
production (ml)
Theoretical maximum H 2
production reached (%)
HMY (mol
H 2 /mol glucose )
0.5
0.045
1500
8.26
36.9
1.48
1
0.09
3000
24.49
54.7
2.19
1.5
0.15
5000
49.75
67
2.67
2
0.18
6000
5.31
1.34
0.24
Inoculum 3000 mg/L VSS
420
D. A. H. Taroepratjeka et al.