

3.2 Biohydrogen Production at 15–26% Salinity
The experiments on biohydrogen production at 15–26% salinity were performed
twice. The first was done before acclimatization and the second was after 2 years of
acclimatization. Table 11.4 compares biohydrogen production at the initial salinity
of 15–26% before acclimatization. The highest production of 2.78 mol H 2 /mol glucose
occurred at 15% salinity. Theoretical hydrogen production value exceeding 100% of
HBu pathway at 15% salinity suggested that the HAc pathway took place.
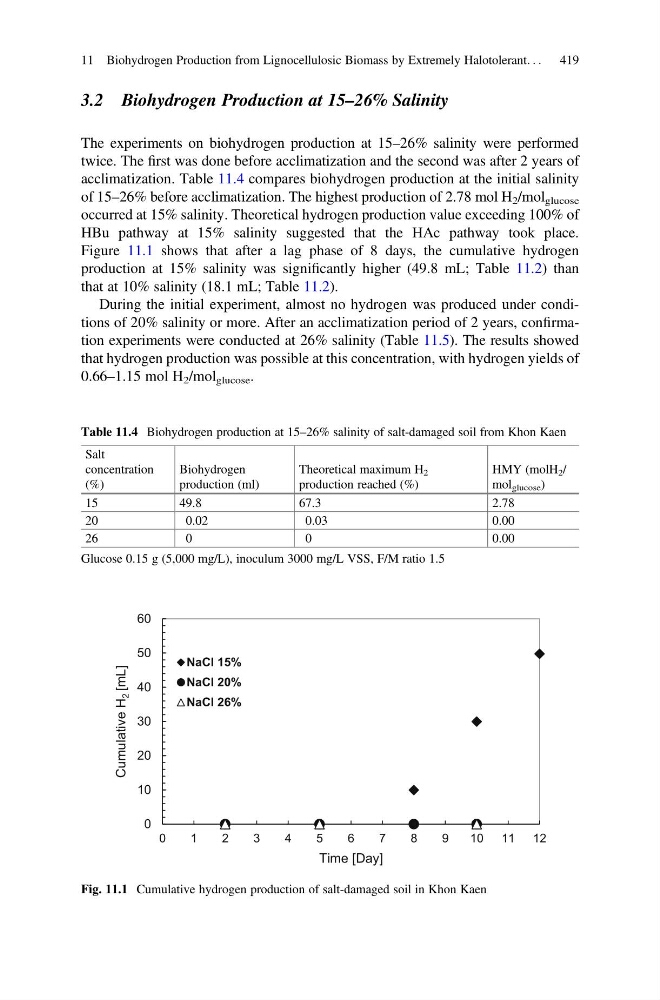
Figure 11.1 shows that after a lag phase of 8 days, the cumulative hydrogen
production at 15% salinity was significantly higher (49.8 mL; Table 11.2) than
that at 10% salinity (18.1 mL; Table 11.2).
During the initial experiment, almost no hydrogen was produced under conditions of 20% salinity or more. After an acclimatization period of 2 years, confirmation experiments were conducted at 26% salinity (Table 11.5). The results showed
that hydrogen production was possible at this concentration, with hydrogen yields of
0.66–1.15 mol H 2 /mol glucose .
Table 11.4 Biohydrogen production at 15–26% salinity of salt-damaged soil from Khon Kaen
Salt
concentration
(%)
Biohydrogen
production (ml)
Theoretical maximum H 2
production reached (%)
HMY (molH 2 /
mol glucose )
15
49.8
67.3
2.78
20
0.02
0.03
0.00
26
0
0
0.00
Glucose 0.15 g (5,000 mg/L), inoculum 3000 mg/L VSS, F/M ratio 1.5
0
10
20
30
40
50
60
0
1
2
3
4
5
6
7
8
9
10 11 12
Cumulative H
2 [mL]
Time [Day]
NaCl 15%
NaCl 20%
NaCl 26%
Fig. 11.1 Cumulative hydrogen production of salt-damaged soil in Khon Kaen
11 Biohydrogen Production from Lignocellulosic Biomass by Extremely Halotolerant. . . 419
The experiments on biohydrogen production at 15–26% salinity were performed
twice. The first was done before acclimatization and the second was after 2 years of
acclimatization. Table 11.4 compares biohydrogen production at the initial salinity
of 15–26% before acclimatization. The highest production of 2.78 mol H 2 /mol glucose
occurred at 15% salinity. Theoretical hydrogen production value exceeding 100% of
HBu pathway at 15% salinity suggested that the HAc pathway took place.
Figure 11.1 shows that after a lag phase of 8 days, the cumulative hydrogen
production at 15% salinity was significantly higher (49.8 mL; Table 11.2) than
that at 10% salinity (18.1 mL; Table 11.2).
During the initial experiment, almost no hydrogen was produced under conditions of 20% salinity or more. After an acclimatization period of 2 years, confirmation experiments were conducted at 26% salinity (Table 11.5). The results showed
that hydrogen production was possible at this concentration, with hydrogen yields of
0.66–1.15 mol H 2 /mol glucose .
Table 11.4 Biohydrogen production at 15–26% salinity of salt-damaged soil from Khon Kaen
Salt
concentration
(%)
Biohydrogen
production (ml)
Theoretical maximum H 2
production reached (%)
HMY (molH 2 /
mol glucose )
15
49.8
67.3
2.78
20
0.02
0.03
0.00
26
0
0
0.00
Glucose 0.15 g (5,000 mg/L), inoculum 3000 mg/L VSS, F/M ratio 1.5
0
10
20
30
40
50
60
0
1
2
3
4
5
6
7
8
9
10 11 12
Cumulative H
2 [mL]
Time [Day]
NaCl 15%
NaCl 20%
NaCl 26%
Fig. 11.1 Cumulative hydrogen production of salt-damaged soil in Khon Kaen
11 Biohydrogen Production from Lignocellulosic Biomass by Extremely Halotolerant. . . 419