

asbestos cement or ductile iron; distribution lines (100 and 150 mm) are polyvinyl
chloride (PVC); and house connections (19–32 mm) are either PVC or polyethylene
(PE).
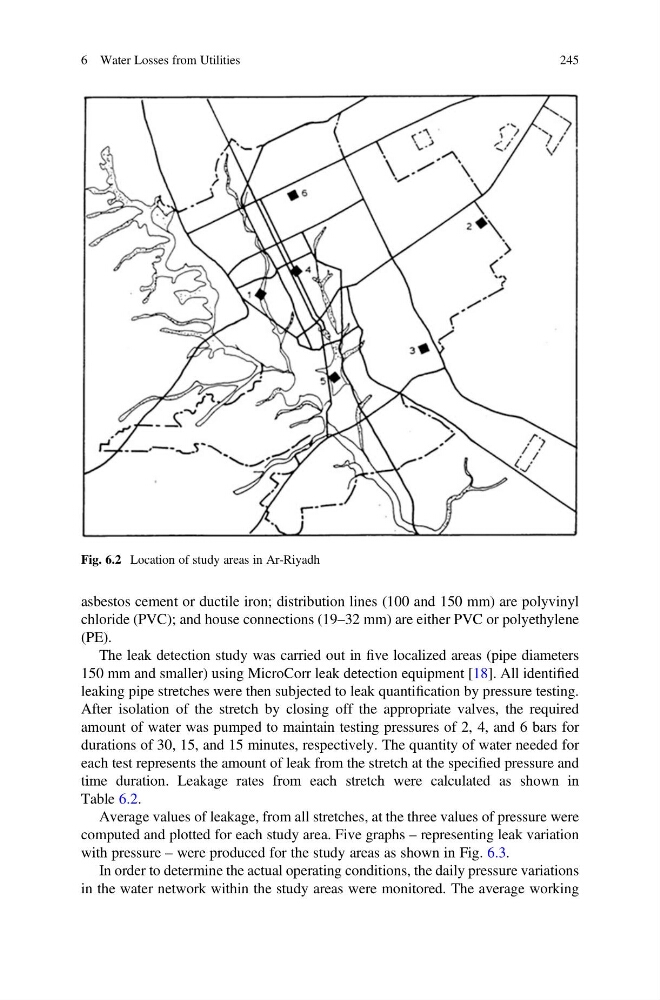
The leak detection study was carried out in five localized areas (pipe diameters
150 mm and smaller) using MicroCorr leak detection equipment [18]. All identified
leaking pipe stretches were then subjected to leak quantification by pressure testing.
After isolation of the stretch by closing off the appropriate valves, the required
amount of water was pumped to maintain testing pressures of 2, 4, and 6 bars for
durations of 30, 15, and 15 minutes, respectively. The quantity of water needed for
each test represents the amount of leak from the stretch at the specified pressure and
time duration. Leakage rates from each stretch were calculated as shown in
Table 6.2.
Average values of leakage, from all stretches, at the three values of pressure were
computed and plotted for each study area. Five graphs – representing leak variation
with pressure – were produced for the study areas as shown in Fig. 6.3.
In order to determine the actual operating conditions, the daily pressure variations
in the water network within the study areas were monitored. The average working
Fig. 6.2 Location of study areas in Ar-Riyadh
6 Water Losses from Utilities
245
chloride (PVC); and house connections (19–32 mm) are either PVC or polyethylene
(PE).
The leak detection study was carried out in five localized areas (pipe diameters
150 mm and smaller) using MicroCorr leak detection equipment [18]. All identified
leaking pipe stretches were then subjected to leak quantification by pressure testing.
After isolation of the stretch by closing off the appropriate valves, the required
amount of water was pumped to maintain testing pressures of 2, 4, and 6 bars for
durations of 30, 15, and 15 minutes, respectively. The quantity of water needed for
each test represents the amount of leak from the stretch at the specified pressure and
time duration. Leakage rates from each stretch were calculated as shown in
Table 6.2.
Average values of leakage, from all stretches, at the three values of pressure were
computed and plotted for each study area. Five graphs – representing leak variation
with pressure – were produced for the study areas as shown in Fig. 6.3.
In order to determine the actual operating conditions, the daily pressure variations
in the water network within the study areas were monitored. The average working
Fig. 6.2 Location of study areas in Ar-Riyadh
6 Water Losses from Utilities
245