

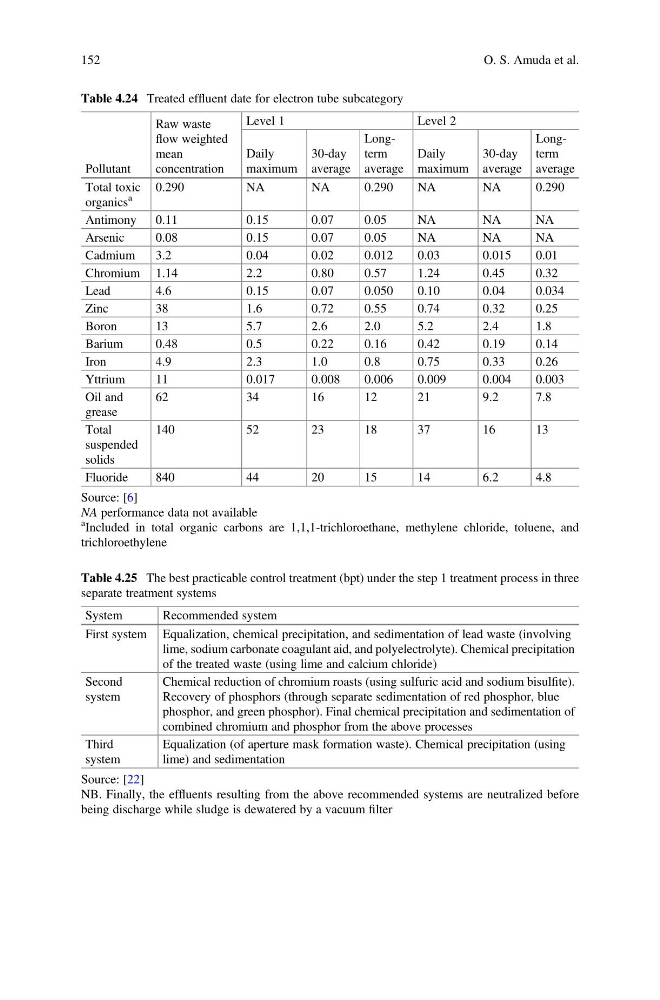
Table 4.24 Treated effluent date for electron tube subcategory
Pollutant
Raw waste
flow weighted
mean
concentration
Level 1
Level 2
Daily
maximum
30-day
average
Longterm
average
Daily
maximum
30-day
average
Longterm
average
Total toxic
organics
a
0.290
NA
NA
0.290
NA
NA
0.290
Antimony 0.11
0.15
0.07
0.05
NA
NA
NA
Arsenic
0.08
0.15
0.07
0.05
NA
NA
NA
Cadmium
3.2
0.04
0.02
0.012
0.03
0.015
0.01
Chromium 1.14
2.2
0.80
0.57
1.24
0.45
0.32
Lead
4.6
0.15
0.07
0.050
0.10
0.04
0.034
Zinc
38
1.6
0.72
0.55
0.74
0.32
0.25
Boron
13
5.7
2.6
2.0
5.2
2.4
1.8
Barium
0.48
0.5
0.22
0.16
0.42
0.19
0.14
Iron
4.9
2.3
1.0
0.8
0.75
0.33
0.26
Yttrium
11
0.017
0.008
0.006
0.009
0.004
0.003
Oil and
grease
62
34
16
12
21
9.2
7.8
Total
suspended
solids
140
52
23
18
37
16
13
Fluoride
840
44
20
15
14
6.2
4.8
Source: [6]
NA performance data not available
a Included in total organic carbons are 1,1,1-trichloroethane, methylene chloride, toluene, and
trichloroethylene
Table 4.25 The best practicable control treatment (bpt) under the step 1 treatment process in three
separate treatment systems
System
Recommended system
First system Equalization, chemical precipitation, and sedimentation of lead waste (involving
lime, sodium carbonate coagulant aid, and polyelectrolyte). Chemical precipitation
of the treated waste (using lime and calcium chloride)
Second
system
Chemical reduction of chromium roasts (using sulfuric acid and sodium bisulfite).
Recovery of phosphors (through separate sedimentation of red phosphor, blue
phosphor, and green phosphor). Final chemical precipitation and sedimentation of
combined chromium and phosphor from the above processes
Third
system
Equalization (of aperture mask formation waste). Chemical precipitation (using
lime) and sedimentation
Source: [22]
NB. Finally, the effluents resulting from the above recommended systems are neutralized before
being discharge while sludge is dewatered by a vacuum filter
152
O. S. Amuda et al.
Pollutant
Raw waste
flow weighted
mean
concentration
Level 1
Level 2
Daily
maximum
30-day
average
Longterm
average
Daily
maximum
30-day
average
Longterm
average
Total toxic
organics
a
0.290
NA
NA
0.290
NA
NA
0.290
Antimony 0.11
0.15
0.07
0.05
NA
NA
NA
Arsenic
0.08
0.15
0.07
0.05
NA
NA
NA
Cadmium
3.2
0.04
0.02
0.012
0.03
0.015
0.01
Chromium 1.14
2.2
0.80
0.57
1.24
0.45
0.32
Lead
4.6
0.15
0.07
0.050
0.10
0.04
0.034
Zinc
38
1.6
0.72
0.55
0.74
0.32
0.25
Boron
13
5.7
2.6
2.0
5.2
2.4
1.8
Barium
0.48
0.5
0.22
0.16
0.42
0.19
0.14
Iron
4.9
2.3
1.0
0.8
0.75
0.33
0.26
Yttrium
11
0.017
0.008
0.006
0.009
0.004
0.003
Oil and
grease
62
34
16
12
21
9.2
7.8
Total
suspended
solids
140
52
23
18
37
16
13
Fluoride
840
44
20
15
14
6.2
4.8
Source: [6]
NA performance data not available
a Included in total organic carbons are 1,1,1-trichloroethane, methylene chloride, toluene, and
trichloroethylene
Table 4.25 The best practicable control treatment (bpt) under the step 1 treatment process in three
separate treatment systems
System
Recommended system
First system Equalization, chemical precipitation, and sedimentation of lead waste (involving
lime, sodium carbonate coagulant aid, and polyelectrolyte). Chemical precipitation
of the treated waste (using lime and calcium chloride)
Second
system
Chemical reduction of chromium roasts (using sulfuric acid and sodium bisulfite).
Recovery of phosphors (through separate sedimentation of red phosphor, blue
phosphor, and green phosphor). Final chemical precipitation and sedimentation of
combined chromium and phosphor from the above processes
Third
system
Equalization (of aperture mask formation waste). Chemical precipitation (using
lime) and sedimentation
Source: [22]
NB. Finally, the effluents resulting from the above recommended systems are neutralized before
being discharge while sludge is dewatered by a vacuum filter
152
O. S. Amuda et al.