

involving carbonyl groups making hydrogen bonds with amine groups in the side
chains of amino acids such as lysine or arginine. The weak amide I
0 mode at
1683 cm
À1 arises from non-hydrogen bonded carbonyl groups. The independence
of the intensity of the amide I
0 mode on the electrode potential indicates that collagen
molecules adopt a stiff, rigid orientation in the film adsorbed on the Au electrode
surface. In situ ellipsometry studies show that the potential induced phase transiton
from the state II to state I is due to the flow of electrolyte solution into the collagen
film [46]. To compensate the net negative charge of the Au electrode the cations
from the electrolyte solution are attracted to the electrode surface swelling the
collagen film. The electrical potentials have no effect on the conformation and
secondary structure of adsorbed collagen molecules [46].
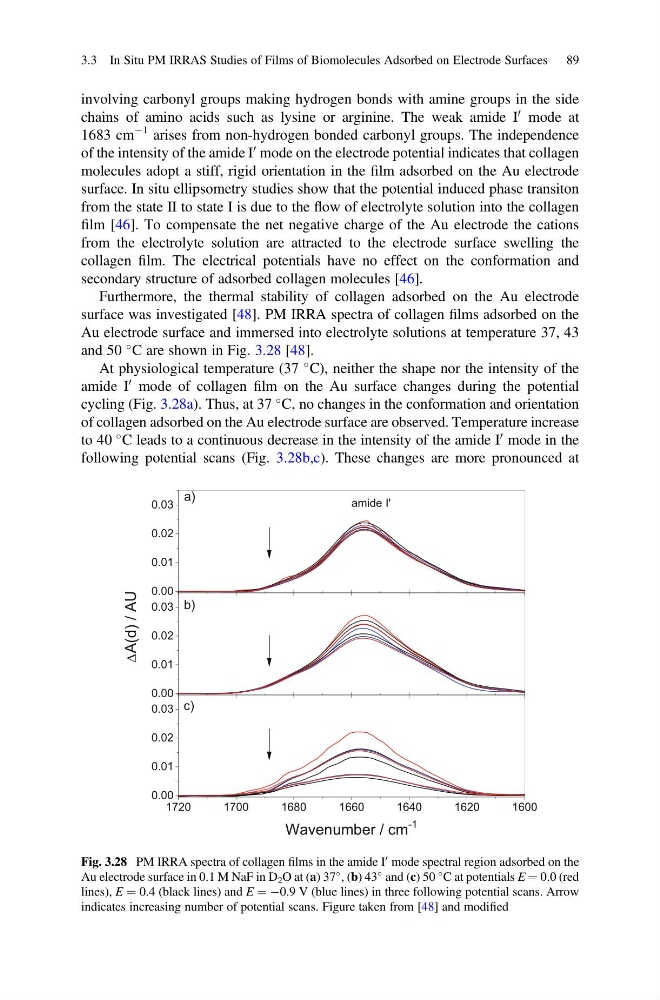
Furthermore, the thermal stability of collagen adsorbed on the Au electrode
surface was investigated [48]. PM IRRA spectra of collagen films adsorbed on the
Au electrode surface and immersed into electrolyte solutions at temperature 37, 43
and 50
C are shown in Fig. 3.28 [48].
At physiological temperature (37
C), neither the shape nor the intensity of the
amide I
0 mode of collagen film on the Au surface changes during the potential
cycling (Fig. 3.28a). Thus, at 37
C, no changes in the conformation and orientation
of collagen adsorbed on the Au electrode surface are observed. Temperature increase
to 40
C leads to a continuous decrease in the intensity of the amide I
0 mode in the
following potential scans (Fig. 3.28b,c). These changes are more pronounced at
1720
1700
1680
1660
1640
1620
1600
0.00
0.01
0.02
0.03
0.00
0.01
0.02
0.03
0.00
0.01
0.02
0.03
Wavenumber / cm
-1
c)
a)
amide I'
U
A
/
)
d
(
A
b)
Fig. 3.28 PM IRRA spectra of collagen films in the amide I
0 mode spectral region adsorbed on the
Au electrode surface in 0.1 M NaF in D 2 O at (a) 37
, (b) 43
and (c) 50
C at potentials E ¼ 0.0 (red
lines), E ¼ 0.4 (black lines) and E ¼ À0.9 V (blue lines) in three following potential scans. Arrow
indicates increasing number of potential scans. Figure taken from [48] and modified
3.3 In Situ PM IRRAS Studies of Films of Biomolecules Adsorbed on Electrode Surfaces 89
chains of amino acids such as lysine or arginine. The weak amide I
0 mode at
1683 cm
À1 arises from non-hydrogen bonded carbonyl groups. The independence
of the intensity of the amide I
0 mode on the electrode potential indicates that collagen
molecules adopt a stiff, rigid orientation in the film adsorbed on the Au electrode
surface. In situ ellipsometry studies show that the potential induced phase transiton
from the state II to state I is due to the flow of electrolyte solution into the collagen
film [46]. To compensate the net negative charge of the Au electrode the cations
from the electrolyte solution are attracted to the electrode surface swelling the
collagen film. The electrical potentials have no effect on the conformation and
secondary structure of adsorbed collagen molecules [46].
Furthermore, the thermal stability of collagen adsorbed on the Au electrode
surface was investigated [48]. PM IRRA spectra of collagen films adsorbed on the
Au electrode surface and immersed into electrolyte solutions at temperature 37, 43
and 50
C are shown in Fig. 3.28 [48].
At physiological temperature (37
C), neither the shape nor the intensity of the
amide I
0 mode of collagen film on the Au surface changes during the potential
cycling (Fig. 3.28a). Thus, at 37
C, no changes in the conformation and orientation
of collagen adsorbed on the Au electrode surface are observed. Temperature increase
to 40
C leads to a continuous decrease in the intensity of the amide I
0 mode in the
following potential scans (Fig. 3.28b,c). These changes are more pronounced at
1720
1700
1680
1660
1640
1620
1600
0.00
0.01
0.02
0.03
0.00
0.01
0.02
0.03
0.00
0.01
0.02
0.03
Wavenumber / cm
-1
c)
a)
amide I'
U
A
/
)
d
(
A
b)
Fig. 3.28 PM IRRA spectra of collagen films in the amide I
0 mode spectral region adsorbed on the
Au electrode surface in 0.1 M NaF in D 2 O at (a) 37
, (b) 43
and (c) 50
C at potentials E ¼ 0.0 (red
lines), E ¼ 0.4 (black lines) and E ¼ À0.9 V (blue lines) in three following potential scans. Arrow
indicates increasing number of potential scans. Figure taken from [48] and modified
3.3 In Situ PM IRRAS Studies of Films of Biomolecules Adsorbed on Electrode Surfaces 89