

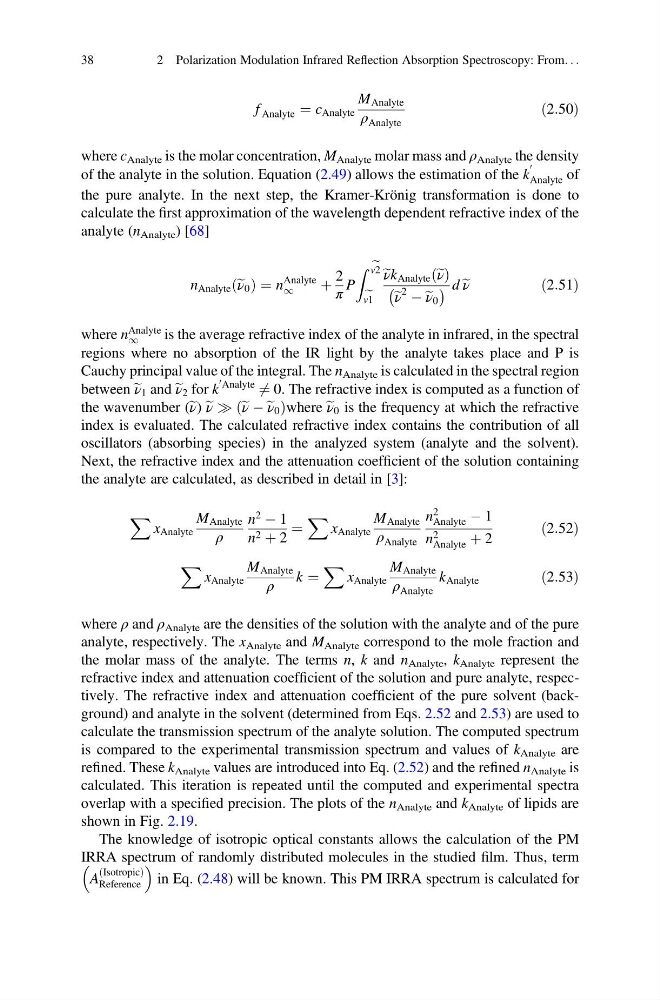
f Analyte ¼ c Analyte
M Analyte
ρ Analyte
ð2:50Þ
where c Analyte is the molar concentration, M Analyte molar mass and ρ Analyte the density
of the analyte in the solution. Equation (2.49) allows the estimation of the k
0
Analyte of
the pure analyte. In the next step, the Kramer-Krönig transformation is done to
calculate the first approximation of the wavelength dependent refractive index of the
analyte (n Analyte ) [68]
n Analyte e ν 0
ð Þ ¼ n
Analyte
1
þ
2
π
P
Z e
v2
e
v1
e νk Analyte e ν
ð Þ
e ν
2 À e ν 0
À
Á d e ν
ð2:51Þ
where n
Analyte
1
is the average refractive index of the analyte in infrared, in the spectral
regions where no absorption of the IR light by the analyte takes place and P is
Cauchy principal value of the integral. The n Analyte is calculated in the spectral region
between e ν 1 and e ν 2 for k
0 Analyte
6 ¼ 0. The refractive index is computed as a function of
the wavenumber (e ν) e ν ) e ν À e ν 0
ð
Þwhere e ν 0 is the frequency at which the refractive
index is evaluated. The calculated refractive index contains the contribution of all
oscillators (absorbing species) in the analyzed system (analyte and the solvent).
Next, the refractive index and the attenuation coefficient of the solution containing
the analyte are calculated, as described in detail in [3]:
X
x Analyte
M Analyte
ρ
n
2
À 1
n 2 þ 2
¼
X
x Analyte
M Analyte
ρ Analyte
n
2
Analyte À 1
n 2
Analyte þ 2
ð2:52Þ
X
x Analyte
M Analyte
ρ
k ¼
X
x Analyte
M Analyte
ρ Analyte
k Analyte
ð2:53Þ
where ρ and ρ Analyte are the densities of the solution with the analyte and of the pure
analyte, respectively. The x Analyte and M Analyte correspond to the mole fraction and
the molar mass of the analyte. The terms n, k and n Analyte , k Analyte represent the
refractive index and attenuation coefficient of the solution and pure analyte, respectively. The refractive index and attenuation coefficient of the pure solvent (background) and analyte in the solvent (determined from Eqs. 2.52 and 2.53) are used to
calculate the transmission spectrum of the analyte solution. The computed spectrum
is compared to the experimental transmission spectrum and values of k Analyte are
refined. These k Analyte values are introduced into Eq. (2.52) and the refined n Analyte is
calculated. This iteration is repeated until the computed and experimental spectra
overlap with a specified precision. The plots of the n Analyte and k Analyte of lipids are
shown in Fig. 2.19.
The knowledge of isotropic optical constants allows the calculation of the PM
IRRA spectrum of randomly distributed molecules in the studied film. Thus, term
A
Isotropic
ð
Þ
Reference
in Eq. (2.48) will be known. This PM IRRA spectrum is calculated for
38
2 Polarization Modulation Infrared Reflection Absorption Spectroscopy: From. . .
M Analyte
ρ Analyte
ð2:50Þ
where c Analyte is the molar concentration, M Analyte molar mass and ρ Analyte the density
of the analyte in the solution. Equation (2.49) allows the estimation of the k
0
Analyte of
the pure analyte. In the next step, the Kramer-Krönig transformation is done to
calculate the first approximation of the wavelength dependent refractive index of the
analyte (n Analyte ) [68]
n Analyte e ν 0
ð Þ ¼ n
Analyte
1
þ
2
π
P
Z e
v2
e
v1
e νk Analyte e ν
ð Þ
e ν
2 À e ν 0
À
Á d e ν
ð2:51Þ
where n
Analyte
1
is the average refractive index of the analyte in infrared, in the spectral
regions where no absorption of the IR light by the analyte takes place and P is
Cauchy principal value of the integral. The n Analyte is calculated in the spectral region
between e ν 1 and e ν 2 for k
0 Analyte
6 ¼ 0. The refractive index is computed as a function of
the wavenumber (e ν) e ν ) e ν À e ν 0
ð
Þwhere e ν 0 is the frequency at which the refractive
index is evaluated. The calculated refractive index contains the contribution of all
oscillators (absorbing species) in the analyzed system (analyte and the solvent).
Next, the refractive index and the attenuation coefficient of the solution containing
the analyte are calculated, as described in detail in [3]:
X
x Analyte
M Analyte
ρ
n
2
À 1
n 2 þ 2
¼
X
x Analyte
M Analyte
ρ Analyte
n
2
Analyte À 1
n 2
Analyte þ 2
ð2:52Þ
X
x Analyte
M Analyte
ρ
k ¼
X
x Analyte
M Analyte
ρ Analyte
k Analyte
ð2:53Þ
where ρ and ρ Analyte are the densities of the solution with the analyte and of the pure
analyte, respectively. The x Analyte and M Analyte correspond to the mole fraction and
the molar mass of the analyte. The terms n, k and n Analyte , k Analyte represent the
refractive index and attenuation coefficient of the solution and pure analyte, respectively. The refractive index and attenuation coefficient of the pure solvent (background) and analyte in the solvent (determined from Eqs. 2.52 and 2.53) are used to
calculate the transmission spectrum of the analyte solution. The computed spectrum
is compared to the experimental transmission spectrum and values of k Analyte are
refined. These k Analyte values are introduced into Eq. (2.52) and the refined n Analyte is
calculated. This iteration is repeated until the computed and experimental spectra
overlap with a specified precision. The plots of the n Analyte and k Analyte of lipids are
shown in Fig. 2.19.
The knowledge of isotropic optical constants allows the calculation of the PM
IRRA spectrum of randomly distributed molecules in the studied film. Thus, term
A
Isotropic
ð
Þ
Reference
in Eq. (2.48) will be known. This PM IRRA spectrum is calculated for
38
2 Polarization Modulation Infrared Reflection Absorption Spectroscopy: From. . .