

experimental parameters (thickness of the electrolyte layer, incidence angle, optical
components of the cell) identical with the previously performed in situ (ex situ)
experiments [3]. The surface concentration and thickness of the analyzed film
present on the mirror surface have to be determined by an independent experiment.
The resulting spectrum, calculated from optical constants, corresponds to the random
distribution of investigated molecules in the studied film.
Figure 2.20 shows the deconvoluted PM IRRA spectra of lipid bilayers on the
gold surface measured in ex situ and in situ experiments and the corresponding
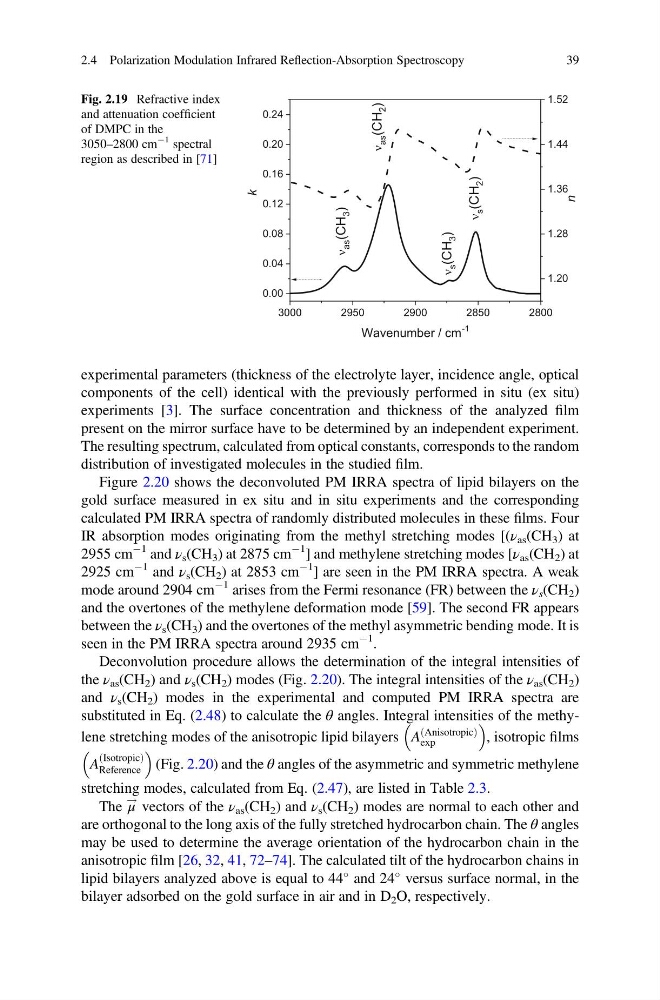
calculated PM IRRA spectra of randomly distributed molecules in these films. Four
IR absorption modes originating from the methyl stretching modes [(ν as (CH 3 ) at
2955 cm
À1 and ν s (CH 3 ) at 2875 cm
À1 ] and methylene stretching modes [ν as (CH 2 ) at
2925 cm
À1 and ν s (CH 2 ) at 2853 cm
À1 ] are seen in the PM IRRA spectra. A weak
mode around 2904 cm
À1 arises from the Fermi resonance (FR) between the ν s (CH 2 )
and the overtones of the methylene deformation mode [59]. The second FR appears
between the ν s (CH 3 ) and the overtones of the methyl asymmetric bending mode. It is
seen in the PM IRRA spectra around 2935 cm
À1 .
Deconvolution procedure allows the determination of the integral intensities of
the ν as (CH 2 ) and ν s (CH 2 ) modes (Fig. 2.20). The integral intensities of the ν as (CH 2 )
and ν s (CH 2 ) modes in the experimental and computed PM IRRA spectra are
substituted in Eq. (2.48) to calculate the θ angles. Integral intensities of the methylene stretching modes of the anisotropic lipid bilayers A
Anisotropic
ð
Þ
exp
, isotropic films
A
Isotropic
ð
Þ
Reference
(Fig. 2.20) and the θ angles of the asymmetric and symmetric methylene
stretching modes, calculated from Eq. (2.47), are listed in Table 2.3.
The μ
! vectors of the ν as (CH 2 ) and ν s (CH 2 ) modes are normal to each other and
are orthogonal to the long axis of the fully stretched hydrocarbon chain. The θ angles
may be used to determine the average orientation of the hydrocarbon chain in the
anisotropic film [26, 32, 41, 72–74]. The calculated tilt of the hydrocarbon chains in
lipid bilayers analyzed above is equal to 44
and 24
versus surface normal, in the
bilayer adsorbed on the gold surface in air and in D 2 O, respectively.
3000
2950
2900
2850
2800
0.00
0.04
0.08
0.12
0.16
0.20
0.24
1.20
1.28
1.36
1.44
1.52
k
Wavenumber / cm
-1
n
s (CH
2 )
s (CH
3 )
as (CH
2 )
as (CH
3 )
Fig. 2.19 Refractive index
and attenuation coefficient
of DMPC in the
3050–2800 cm
À1 spectral
region as described in [71]
2.4 Polarization Modulation Infrared Reflection-Absorption Spectroscopy
39
components of the cell) identical with the previously performed in situ (ex situ)
experiments [3]. The surface concentration and thickness of the analyzed film
present on the mirror surface have to be determined by an independent experiment.
The resulting spectrum, calculated from optical constants, corresponds to the random
distribution of investigated molecules in the studied film.
Figure 2.20 shows the deconvoluted PM IRRA spectra of lipid bilayers on the
gold surface measured in ex situ and in situ experiments and the corresponding
calculated PM IRRA spectra of randomly distributed molecules in these films. Four
IR absorption modes originating from the methyl stretching modes [(ν as (CH 3 ) at
2955 cm
À1 and ν s (CH 3 ) at 2875 cm
À1 ] and methylene stretching modes [ν as (CH 2 ) at
2925 cm
À1 and ν s (CH 2 ) at 2853 cm
À1 ] are seen in the PM IRRA spectra. A weak
mode around 2904 cm
À1 arises from the Fermi resonance (FR) between the ν s (CH 2 )
and the overtones of the methylene deformation mode [59]. The second FR appears
between the ν s (CH 3 ) and the overtones of the methyl asymmetric bending mode. It is
seen in the PM IRRA spectra around 2935 cm
À1 .
Deconvolution procedure allows the determination of the integral intensities of
the ν as (CH 2 ) and ν s (CH 2 ) modes (Fig. 2.20). The integral intensities of the ν as (CH 2 )
and ν s (CH 2 ) modes in the experimental and computed PM IRRA spectra are
substituted in Eq. (2.48) to calculate the θ angles. Integral intensities of the methylene stretching modes of the anisotropic lipid bilayers A
Anisotropic
ð
Þ
exp
, isotropic films
A
Isotropic
ð
Þ
Reference
(Fig. 2.20) and the θ angles of the asymmetric and symmetric methylene
stretching modes, calculated from Eq. (2.47), are listed in Table 2.3.
The μ
! vectors of the ν as (CH 2 ) and ν s (CH 2 ) modes are normal to each other and
are orthogonal to the long axis of the fully stretched hydrocarbon chain. The θ angles
may be used to determine the average orientation of the hydrocarbon chain in the
anisotropic film [26, 32, 41, 72–74]. The calculated tilt of the hydrocarbon chains in
lipid bilayers analyzed above is equal to 44
and 24
versus surface normal, in the
bilayer adsorbed on the gold surface in air and in D 2 O, respectively.
3000
2950
2900
2850
2800
0.00
0.04
0.08
0.12
0.16
0.20
0.24
1.20
1.28
1.36
1.44
1.52
k
Wavenumber / cm
-1
n
s (CH
2 )
s (CH
3 )
as (CH
2 )
as (CH
3 )
Fig. 2.19 Refractive index
and attenuation coefficient
of DMPC in the
3050–2800 cm
À1 spectral
region as described in [71]
2.4 Polarization Modulation Infrared Reflection-Absorption Spectroscopy
39