

The IR spectrum shows interference fringes which are due to multiple reflections
of the IR light between the two optical windows in the gap which size (D) is
comparable to the wavelength of the incoming radiation,
D ¼
ΔN
2n 1 e ν 2 À e ν 1
ð
Þ
ð2:48Þ
where n 1 is the average refractive index of the medium present in the cell (air n 1 ¼
1), ΔN is the number of fringes (ΔN ¼ 18 in Fig. 2.17) and e ν 2 , and e ν 1 is the
difference in wavenumbers between the maximum (or minimum) of the last and first
fringe. The thickness of the flow cell, whose spectrum is shown in Fig. 2.17, is equal
to 29.5 μm. Next, the solution is pumped into the cell. Two solutions are required in
the measurement: the pure solvent (background spectrum) and the analyte solution
(analyte spectrum). The volume concentration of the analyte and its average refractive index (n
Analyte
1
) have to be known. A resulting transmission spectrum of the
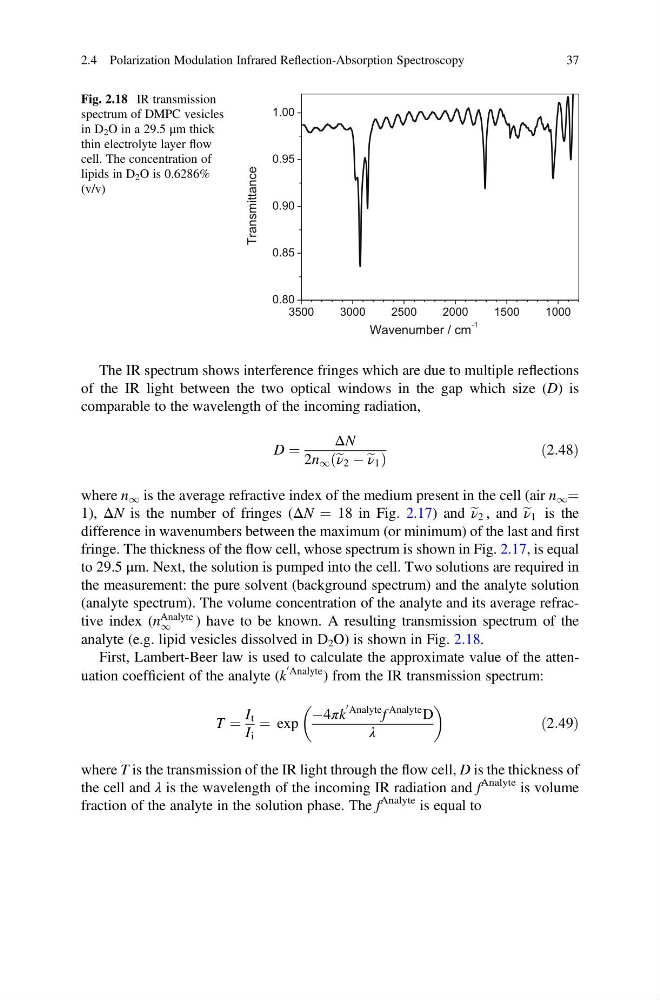
analyte (e.g. lipid vesicles dissolved in D 2 O) is shown in Fig. 2.18.
First, Lambert-Beer law is used to calculate the approximate value of the attenuation coefficient of the analyte (k
0 Analyte ) from the IR transmission spectrum:
T ¼
I t
I i
¼ exp
À4πk
0 Analyte f
Analyte D
λ
ð2:49Þ
where T is the transmission of the IR light through the flow cell, D is the thickness of
the cell and λ is the wavelength of the incoming IR radiation and f
Analyte is volume
fraction of the analyte in the solution phase. The f
Analyte is equal to
3500
3000
2500
2000
1500
1000
0.80
0.85
0.90
0.95
1.00
Transmittance
Wavenumber / cm
-1
Fig. 2.18 IR transmission
spectrum of DMPC vesicles
in D 2 O in a 29.5 μm thick
thin electrolyte layer flow
cell. The concentration of
lipids in D 2 O is 0.6286%
(v/v)
2.4 Polarization Modulation Infrared Reflection-Absorption Spectroscopy
37
of the IR light between the two optical windows in the gap which size (D) is
comparable to the wavelength of the incoming radiation,
D ¼
ΔN
2n 1 e ν 2 À e ν 1
ð
Þ
ð2:48Þ
where n 1 is the average refractive index of the medium present in the cell (air n 1 ¼
1), ΔN is the number of fringes (ΔN ¼ 18 in Fig. 2.17) and e ν 2 , and e ν 1 is the
difference in wavenumbers between the maximum (or minimum) of the last and first
fringe. The thickness of the flow cell, whose spectrum is shown in Fig. 2.17, is equal
to 29.5 μm. Next, the solution is pumped into the cell. Two solutions are required in
the measurement: the pure solvent (background spectrum) and the analyte solution
(analyte spectrum). The volume concentration of the analyte and its average refractive index (n
Analyte
1
) have to be known. A resulting transmission spectrum of the
analyte (e.g. lipid vesicles dissolved in D 2 O) is shown in Fig. 2.18.
First, Lambert-Beer law is used to calculate the approximate value of the attenuation coefficient of the analyte (k
0 Analyte ) from the IR transmission spectrum:
T ¼
I t
I i
¼ exp
À4πk
0 Analyte f
Analyte D
λ
ð2:49Þ
where T is the transmission of the IR light through the flow cell, D is the thickness of
the cell and λ is the wavelength of the incoming IR radiation and f
Analyte is volume
fraction of the analyte in the solution phase. The f
Analyte is equal to
3500
3000
2500
2000
1500
1000
0.80
0.85
0.90
0.95
1.00
Transmittance
Wavenumber / cm
-1
Fig. 2.18 IR transmission
spectrum of DMPC vesicles
in D 2 O in a 29.5 μm thick
thin electrolyte layer flow
cell. The concentration of
lipids in D 2 O is 0.6286%
(v/v)
2.4 Polarization Modulation Infrared Reflection-Absorption Spectroscopy
37