

1
3
R
A
Anisotropic
ð
Þ
exp
d e ν
A
Isotropic
ð
Þ
Reference d e ν
¼ cos
2
θ
ð2:47Þ
The θ angle provides directly the orientation of the μ
! vector with respect to the
surface normal. When in a studied molecule the orientation of the μ
! is known, the
orientation of a particular group in an isotropic film can be calculated. The term
A
Isotropic
ð
Þ
Reference
in Eq. (2.47) remains unknown and it has to be determined before the
quantitative analysis will be done. This requires the knowledge of isotropic optical
constants of molecules in the studied film. They are available either from the
literature or have to be determined in an independent measurement [26, 66, 68–
70]. The isotropic optical constants may be determined from IR transmission
measurement of the analyte molecules in KBr (KCl) pellet [69] or in a solution
phase [66]. The selection of the experimental conditions for transmission measurements depends on the physical state of the analyte, solubility and stability of the
analyte in different solvents as well as on the experimental conditions of PM IRRAS
experiments (e.g. ex situ and in situ). Spectroelectrochemical PM IRRAS experiments are performed at the solution|electrode interface. Therefore, in this kind of
experiments it is recommended to determine the isotropic optical constants from the
solution phase. Allara described the procedure of the determination of the isotropic
optical constants of a given analyte from the IRS transmission measurement [66]. It
requires the use of a thin-layer flow IR transmission cell. Two optical windows
(e.g. BaF 2 , ZnSe) are placed between a thin Teflon spacer (usually 10–50 μm thick),
which determines the volume of the cell. It is mounted in a commercially available
cell holder [77]. The exact thickness of the cell has to be determined before each
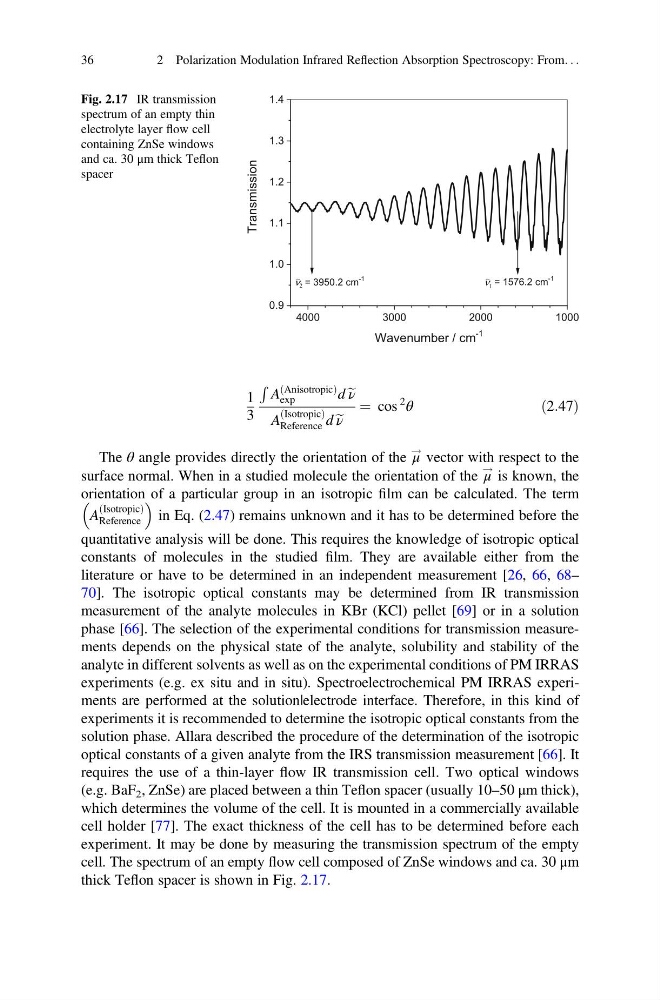
experiment. It may be done by measuring the transmission spectrum of the empty
cell. The spectrum of an empty flow cell composed of ZnSe windows and ca. 30 μm
thick Teflon spacer is shown in Fig. 2.17.
4000
3000
2000
1000
0.9
1.0
1.1
1.2
1.3
1.4
= 1576.2 cm
-1
Transmission
Wavenumber / cm
-1
= 3950.2 cm
-1
1
2
∼
∼
Fig. 2.17 IR transmission
spectrum of an empty thin
electrolyte layer flow cell
containing ZnSe windows
and ca. 30 μm thick Teflon
spacer
36
2 Polarization Modulation Infrared Reflection Absorption Spectroscopy: From. . .
3
R
A
Anisotropic
ð
Þ
exp
d e ν
A
Isotropic
ð
Þ
Reference d e ν
¼ cos
2
θ
ð2:47Þ
The θ angle provides directly the orientation of the μ
! vector with respect to the
surface normal. When in a studied molecule the orientation of the μ
! is known, the
orientation of a particular group in an isotropic film can be calculated. The term
A
Isotropic
ð
Þ
Reference
in Eq. (2.47) remains unknown and it has to be determined before the
quantitative analysis will be done. This requires the knowledge of isotropic optical
constants of molecules in the studied film. They are available either from the
literature or have to be determined in an independent measurement [26, 66, 68–
70]. The isotropic optical constants may be determined from IR transmission
measurement of the analyte molecules in KBr (KCl) pellet [69] or in a solution
phase [66]. The selection of the experimental conditions for transmission measurements depends on the physical state of the analyte, solubility and stability of the
analyte in different solvents as well as on the experimental conditions of PM IRRAS
experiments (e.g. ex situ and in situ). Spectroelectrochemical PM IRRAS experiments are performed at the solution|electrode interface. Therefore, in this kind of
experiments it is recommended to determine the isotropic optical constants from the
solution phase. Allara described the procedure of the determination of the isotropic
optical constants of a given analyte from the IRS transmission measurement [66]. It
requires the use of a thin-layer flow IR transmission cell. Two optical windows
(e.g. BaF 2 , ZnSe) are placed between a thin Teflon spacer (usually 10–50 μm thick),
which determines the volume of the cell. It is mounted in a commercially available
cell holder [77]. The exact thickness of the cell has to be determined before each
experiment. It may be done by measuring the transmission spectrum of the empty
cell. The spectrum of an empty flow cell composed of ZnSe windows and ca. 30 μm
thick Teflon spacer is shown in Fig. 2.17.
4000
3000
2000
1000
0.9
1.0
1.1
1.2
1.3
1.4
= 1576.2 cm
-1
Transmission
Wavenumber / cm
-1
= 3950.2 cm
-1
1
2
∼
∼
Fig. 2.17 IR transmission
spectrum of an empty thin
electrolyte layer flow cell
containing ZnSe windows
and ca. 30 μm thick Teflon
spacer
36
2 Polarization Modulation Infrared Reflection Absorption Spectroscopy: From. . .