

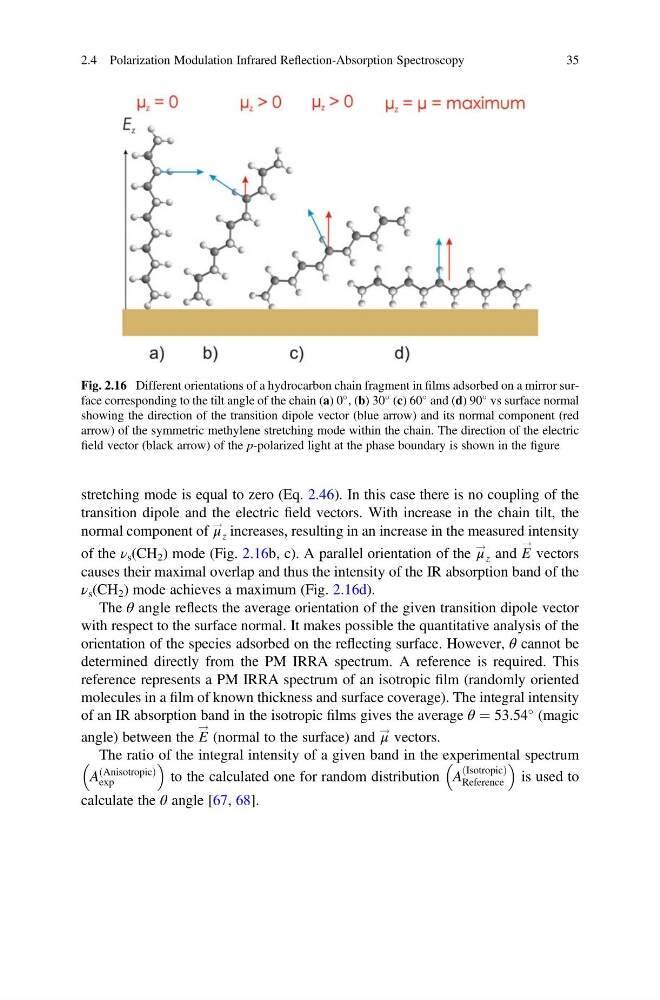
stretching mode is equal to zero (Eq. 2.46). In this case there is no coupling of the
transition dipole and the electric field vectors. With increase in the chain tilt, the
normal component of μ
!
z increases, resulting in an increase in the measured intensity
of the ν s (CH 2 ) mode (Fig. 2.16b, c). A parallel orientation of the μ
!
z and E
!
vectors
causes their maximal overlap and thus the intensity of the IR absorption band of the
ν s (CH 2 ) mode achieves a maximum (Fig. 2.16d).
The θ angle reflects the average orientation of the given transition dipole vector
with respect to the surface normal. It makes possible the quantitative analysis of the
orientation of the species adsorbed on the reflecting surface. However, θ cannot be
determined directly from the PM IRRA spectrum. A reference is required. This
reference represents a PM IRRA spectrum of an isotropic film (randomly oriented
molecules in a film of known thickness and surface coverage). The integral intensity
of an IR absorption band in the isotropic films gives the average θ ¼ 53.54
(magic
angle) between the E
!
(normal to the surface) and μ
! vectors.
The ratio of the integral intensity of a given band in the experimental spectrum
A
Anisotropic
ð
Þ
exp
to the calculated one for random distribution A
Isotropic
ð
Þ
Reference
is used to
calculate the θ angle [67, 68].
Fig. 2.16 Different orientations of a hydrocarbon chain fragment in films adsorbed on a mirror surface corresponding to the tilt angle of the chain (a) 0
, (b) 30
(c) 60
and (d) 90
vs surface normal
showing the direction of the transition dipole vector (blue arrow) and its normal component (red
arrow) of the symmetric methylene stretching mode within the chain. The direction of the electric
field vector (black arrow) of the p-polarized light at the phase boundary is shown in the figure
2.4 Polarization Modulation Infrared Reflection-Absorption Spectroscopy
35
transition dipole and the electric field vectors. With increase in the chain tilt, the
normal component of μ
!
z increases, resulting in an increase in the measured intensity
of the ν s (CH 2 ) mode (Fig. 2.16b, c). A parallel orientation of the μ
!
z and E
!
vectors
causes their maximal overlap and thus the intensity of the IR absorption band of the
ν s (CH 2 ) mode achieves a maximum (Fig. 2.16d).
The θ angle reflects the average orientation of the given transition dipole vector
with respect to the surface normal. It makes possible the quantitative analysis of the
orientation of the species adsorbed on the reflecting surface. However, θ cannot be
determined directly from the PM IRRA spectrum. A reference is required. This
reference represents a PM IRRA spectrum of an isotropic film (randomly oriented
molecules in a film of known thickness and surface coverage). The integral intensity
of an IR absorption band in the isotropic films gives the average θ ¼ 53.54
(magic
angle) between the E
!
(normal to the surface) and μ
! vectors.
The ratio of the integral intensity of a given band in the experimental spectrum
A
Anisotropic
ð
Þ
exp
to the calculated one for random distribution A
Isotropic
ð
Þ
Reference
is used to
calculate the θ angle [67, 68].
Fig. 2.16 Different orientations of a hydrocarbon chain fragment in films adsorbed on a mirror surface corresponding to the tilt angle of the chain (a) 0
, (b) 30
(c) 60
and (d) 90
vs surface normal
showing the direction of the transition dipole vector (blue arrow) and its normal component (red
arrow) of the symmetric methylene stretching mode within the chain. The direction of the electric
field vector (black arrow) of the p-polarized light at the phase boundary is shown in the figure
2.4 Polarization Modulation Infrared Reflection-Absorption Spectroscopy
35