

where θ is the angle between the μ
! and E
!
vectors. Equation (2.46) shows that the
integral intensity of an IR absorption mode depends on the value of the θ angle. In
IRRAS [1, 16], E
!
vector of the p-polarized light is oriented normal to the mirror
surface (Fig. 2.2a). In an anisotropic film, the molecules adsorbed on the solid
surface have the same (similar) orientation, indicating that the μ
! vector of a given
normal vibration has well-defined orientation in all molecules present in this film.
Since the direction of E
!
is constant, any change in the integral intensity of a given IR
absorption mode reflects the orientation of the μ
! vector versus the surface normal.
According to Eq. (2.46), some IR absorption bands may be enhanced while others
may disappear from the PM IRRA spectrum. Figure 2.16 shows different orientations of the methylene groups in a hydrocarbon chain in an anisotropic film adsorbed
on a mirror surface. Hydrocarbon chains are present in most of amphiphilic molecules and therefore the analysis of their orientation is used as an explanatory
example. The transition dipole vector of the asymmetric methylene stretching
mode [ν as (CH 2 )] lies between the two H atoms in the methylene group and of the
symmetric mode [ν s (CH 2 )] in the bisector of the methylene group [56].
Depending on the orientation of the hydrocarbon chain in the film, the transition
dipole vector of the methylene stretching modes changes its orientation from
perpendicular to E
!
(Fig. 2.16a) to parallel to E
!
(Fig. 2.16d). When the angle between
μ
! and E
!
vectors is 90
(Fig. 2.16a) the integral intensity of the asymmetric methylene
0.05
0.10
0.15
0.20
3100 3050 3000 2950 2900 2850 2800
0.000
0.001
0.002
0.003
0.004
0.005
0.006
3100 3050 3000 2950 2900 2850 2800
0.000
0.001
0.002
0.003
0.004
0.005
0.006
0.06
0.08
0.10
0.12
0.14
0.16
c)
d)
Wavenumber / cm
-1
b)
Wavenumber / cm
-1
a)
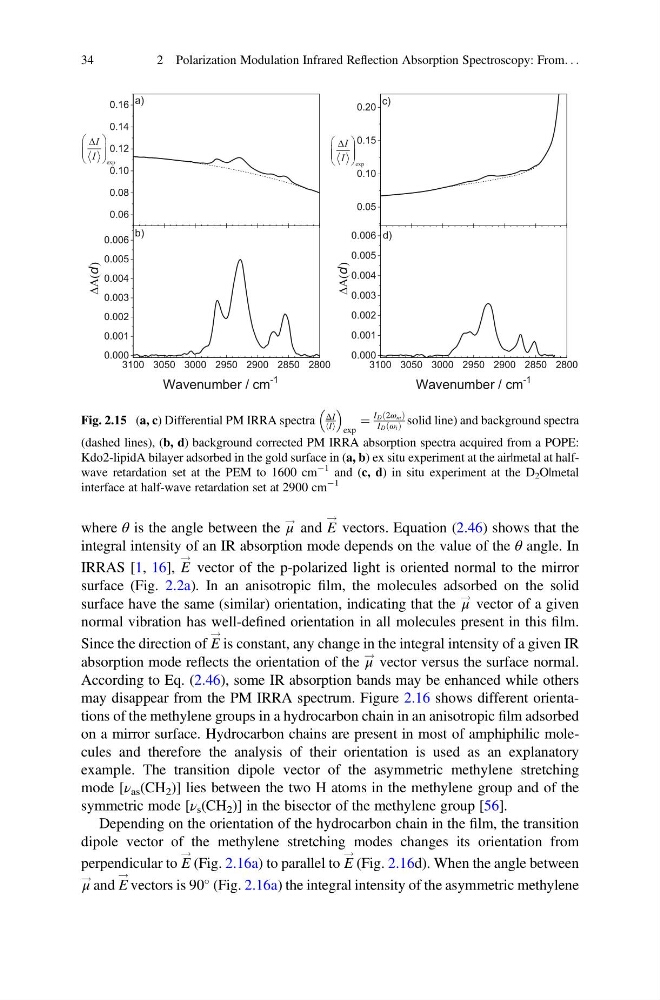
Fig. 2.15 (a, c) Differential PM IRRA spectra
ΔI
I
h i
exp
¼
ID 2ωm
ð
Þ
ID ωi
ð Þ solid line) and background spectra
(dashed lines), (b, d) background corrected PM IRRA absorption spectra acquired from a POPE:
Kdo2-lipidA bilayer adsorbed in the gold surface in (a, b) ex situ experiment at the air|metal at halfwave retardation set at the PEM to 1600 cm
À1 and (c, d) in situ experiment at the D 2 O|metal
interface at half-wave retardation set at 2900 cm
À1
34
2 Polarization Modulation Infrared Reflection Absorption Spectroscopy: From. . .
! and E
!
vectors. Equation (2.46) shows that the
integral intensity of an IR absorption mode depends on the value of the θ angle. In
IRRAS [1, 16], E
!
vector of the p-polarized light is oriented normal to the mirror
surface (Fig. 2.2a). In an anisotropic film, the molecules adsorbed on the solid
surface have the same (similar) orientation, indicating that the μ
! vector of a given
normal vibration has well-defined orientation in all molecules present in this film.
Since the direction of E
!
is constant, any change in the integral intensity of a given IR
absorption mode reflects the orientation of the μ
! vector versus the surface normal.
According to Eq. (2.46), some IR absorption bands may be enhanced while others
may disappear from the PM IRRA spectrum. Figure 2.16 shows different orientations of the methylene groups in a hydrocarbon chain in an anisotropic film adsorbed
on a mirror surface. Hydrocarbon chains are present in most of amphiphilic molecules and therefore the analysis of their orientation is used as an explanatory
example. The transition dipole vector of the asymmetric methylene stretching
mode [ν as (CH 2 )] lies between the two H atoms in the methylene group and of the
symmetric mode [ν s (CH 2 )] in the bisector of the methylene group [56].
Depending on the orientation of the hydrocarbon chain in the film, the transition
dipole vector of the methylene stretching modes changes its orientation from
perpendicular to E
!
(Fig. 2.16a) to parallel to E
!
(Fig. 2.16d). When the angle between
μ
! and E
!
vectors is 90
(Fig. 2.16a) the integral intensity of the asymmetric methylene
0.05
0.10
0.15
0.20
3100 3050 3000 2950 2900 2850 2800
0.000
0.001
0.002
0.003
0.004
0.005
0.006
3100 3050 3000 2950 2900 2850 2800
0.000
0.001
0.002
0.003
0.004
0.005
0.006
0.06
0.08
0.10
0.12
0.14
0.16
c)
d)
Wavenumber / cm
-1
b)
Wavenumber / cm
-1
a)
Fig. 2.15 (a, c) Differential PM IRRA spectra
ΔI
I
h i
exp
¼
ID 2ωm
ð
Þ
ID ωi
ð Þ solid line) and background spectra
(dashed lines), (b, d) background corrected PM IRRA absorption spectra acquired from a POPE:
Kdo2-lipidA bilayer adsorbed in the gold surface in (a, b) ex situ experiment at the air|metal at halfwave retardation set at the PEM to 1600 cm
À1 and (c, d) in situ experiment at the D 2 O|metal
interface at half-wave retardation set at 2900 cm
À1
34
2 Polarization Modulation Infrared Reflection Absorption Spectroscopy: From. . .