

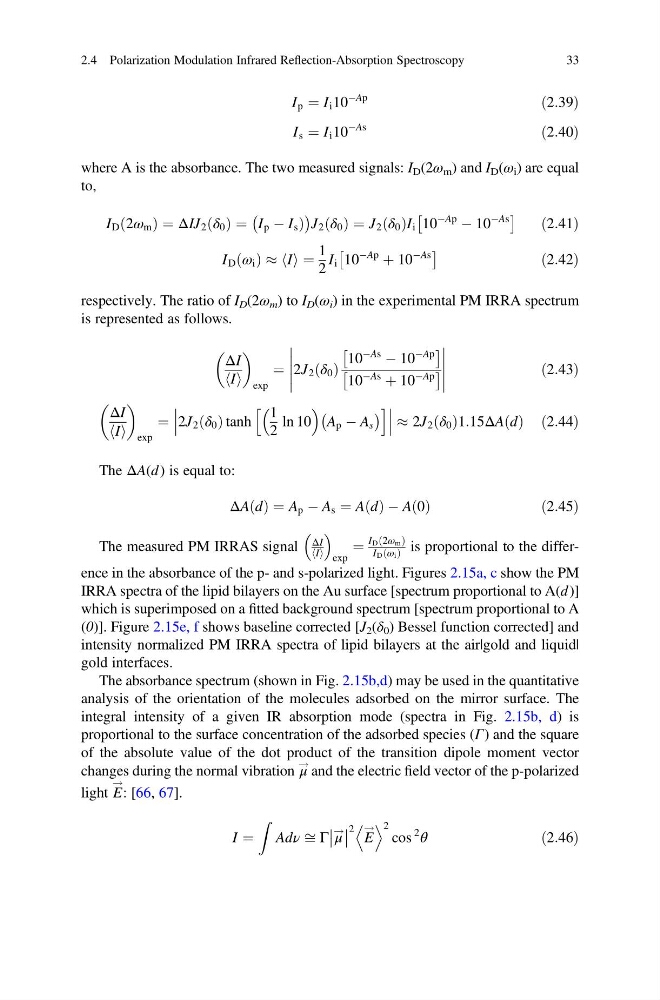
I p ¼ I i 10
ÀAp
ð2:39Þ
I s ¼ I i 10
ÀAs
ð2:40Þ
where A is the absorbance. The two measured signals: I D (2ω m ) and I D (ω i ) are equal
to,
I D 2ω m
ð
Þ ¼ΔIJ 2 δ 0
ð Þ ¼ I p À I s Þ
À
Á
J 2 δ 0
ð Þ ¼ J 2 δ 0
ð ÞI i 10
ÀAp
À 10
ÀAs
Â
Ã
ð2:41Þ
I D ω i
ð Þ % I
h i ¼
1
2
I i 10
ÀAp
þ 10
ÀAs
Â
Ã
ð2:42Þ
respectively. The ratio of I D (2ω m ) to I D (ω i ) in the experimental PM IRRA spectrum
is represented as follows.
ΔI
I
h i
exp
¼ 2J 2 δ 0
ð Þ
10
ÀAs
À 10
ÀAp
Â
Ã
10
ÀAs
þ 10
ÀAp
Â
Ã
ð2:43Þ
ΔI
I
h i
exp
¼ 2J 2 δ 0
ð Þtanh
1
2
ln 10
A p À A s
À
Á
h
i
% 2J 2 δ 0
ð Þ1:15ΔA d
ð Þ ð2:44Þ
The ΔA(d ) is equal to:
ΔA d
ð Þ ¼ A p À A s ¼ A d
ð Þ À A 0
ð Þ
ð2:45Þ
The measured PM IRRAS signal
ΔI
I
h i
exp
¼
I D 2ω m
ð
Þ
I D ω i
ð Þ is proportional to the difference in the absorbance of the p- and s-polarized light. Figures 2.15a, c show the PM
IRRA spectra of the lipid bilayers on the Au surface [spectrum proportional to A(d)]
which is superimposed on a fitted background spectrum [spectrum proportional to A
(0)]. Figure 2.15e, f shows baseline corrected [J 2 (δ 0 ) Bessel function corrected] and
intensity normalized PM IRRA spectra of lipid bilayers at the air|gold and liquid|
gold interfaces.
The absorbance spectrum (shown in Fig. 2.15b,d) may be used in the quantitative
analysis of the orientation of the molecules adsorbed on the mirror surface. The
integral intensity of a given IR absorption mode (spectra in Fig. 2.15b, d) is
proportional to the surface concentration of the adsorbed species (Γ) and the square
of the absolute value of the dot product of the transition dipole moment vector
changes during the normal vibration μ
! and the electric field vector of the p-polarized
light E
!
: [66, 67].
I ¼
Z
Adν ffi Γ μ
!
2 E
!
D E 2
cos
2
θ
ð2:46Þ
2.4 Polarization Modulation Infrared Reflection-Absorption Spectroscopy
33
ÀAp
ð2:39Þ
I s ¼ I i 10
ÀAs
ð2:40Þ
where A is the absorbance. The two measured signals: I D (2ω m ) and I D (ω i ) are equal
to,
I D 2ω m
ð
Þ ¼ΔIJ 2 δ 0
ð Þ ¼ I p À I s Þ
À
Á
J 2 δ 0
ð Þ ¼ J 2 δ 0
ð ÞI i 10
ÀAp
À 10
ÀAs
Â
Ã
ð2:41Þ
I D ω i
ð Þ % I
h i ¼
1
2
I i 10
ÀAp
þ 10
ÀAs
Â
Ã
ð2:42Þ
respectively. The ratio of I D (2ω m ) to I D (ω i ) in the experimental PM IRRA spectrum
is represented as follows.
ΔI
I
h i
exp
¼ 2J 2 δ 0
ð Þ
10
ÀAs
À 10
ÀAp
Â
Ã
10
ÀAs
þ 10
ÀAp
Â
Ã
ð2:43Þ
ΔI
I
h i
exp
¼ 2J 2 δ 0
ð Þtanh
1
2
ln 10
A p À A s
À
Á
h
i
% 2J 2 δ 0
ð Þ1:15ΔA d
ð Þ ð2:44Þ
The ΔA(d ) is equal to:
ΔA d
ð Þ ¼ A p À A s ¼ A d
ð Þ À A 0
ð Þ
ð2:45Þ
The measured PM IRRAS signal
ΔI
I
h i
exp
¼
I D 2ω m
ð
Þ
I D ω i
ð Þ is proportional to the difference in the absorbance of the p- and s-polarized light. Figures 2.15a, c show the PM
IRRA spectra of the lipid bilayers on the Au surface [spectrum proportional to A(d)]
which is superimposed on a fitted background spectrum [spectrum proportional to A
(0)]. Figure 2.15e, f shows baseline corrected [J 2 (δ 0 ) Bessel function corrected] and
intensity normalized PM IRRA spectra of lipid bilayers at the air|gold and liquid|
gold interfaces.
The absorbance spectrum (shown in Fig. 2.15b,d) may be used in the quantitative
analysis of the orientation of the molecules adsorbed on the mirror surface. The
integral intensity of a given IR absorption mode (spectra in Fig. 2.15b, d) is
proportional to the surface concentration of the adsorbed species (Γ) and the square
of the absolute value of the dot product of the transition dipole moment vector
changes during the normal vibration μ
! and the electric field vector of the p-polarized
light E
!
: [66, 67].
I ¼
Z
Adν ffi Γ μ
!
2 E
!
D E 2
cos
2
θ
ð2:46Þ
2.4 Polarization Modulation Infrared Reflection-Absorption Spectroscopy
33