

below 1400 cm
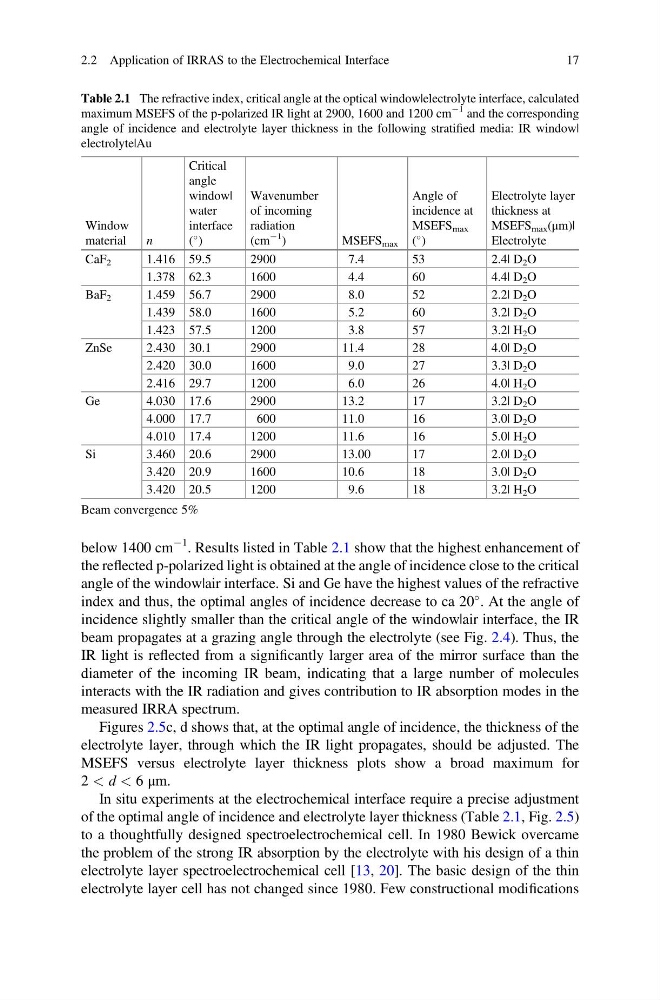
À1 . Results listed in Table 2.1 show that the highest enhancement of
the reflected p-polarized light is obtained at the angle of incidence close to the critical
angle of the window|air interface. Si and Ge have the highest values of the refractive
index and thus, the optimal angles of incidence decrease to ca 20
. At the angle of
incidence slightly smaller than the critical angle of the window|air interface, the IR
beam propagates at a grazing angle through the electrolyte (see Fig. 2.4). Thus, the
IR light is reflected from a significantly larger area of the mirror surface than the
diameter of the incoming IR beam, indicating that a large number of molecules
interacts with the IR radiation and gives contribution to IR absorption modes in the
measured IRRA spectrum.
Figures 2.5c, d shows that, at the optimal angle of incidence, the thickness of the
electrolyte layer, through which the IR light propagates, should be adjusted. The
MSEFS versus electrolyte layer thickness plots show a broad maximum for
2 < d < 6 μm.
In situ experiments at the electrochemical interface require a precise adjustment
of the optimal angle of incidence and electrolyte layer thickness (Table 2.1, Fig. 2.5)
to a thoughtfully designed spectroelectrochemical cell. In 1980 Bewick overcame
the problem of the strong IR absorption by the electrolyte with his design of a thin
electrolyte layer spectroelectrochemical cell [13, 20]. The basic design of the thin
electrolyte layer cell has not changed since 1980. Few constructional modifications
Table 2.1 The refractive index, critical angle at the optical window|electrolyte interface, calculated
maximum MSEFS of the p-polarized IR light at 2900, 1600 and 1200 cm
À1 and the corresponding
angle of incidence and electrolyte layer thickness in the following stratified media: IR window|
electrolyte|Au
Window
material
n
Critical
angle
window|
water
interface
(
)
Wavenumber
of incoming
radiation
(cm
À1
)
MSEFS max
Angle of
incidence at
MSEFS max
(
)
Electrolyte layer
thickness at
MSEFS max (μm)|
Electrolyte
CaF 2
1.416 59.5
2900
7.4
53
2.4| D 2 O
1.378 62.3
1600
4.4
60
4.4| D 2 O
BaF 2
1.459 56.7
2900
8.0
52
2.2| D 2 O
1.439 58.0
1600
5.2
60
3.2| D 2 O
1.423 57.5
1200
3.8
57
3.2| H 2 O
ZnSe
2.430 30.1
2900
11.4
28
4.0| D 2 O
2.420 30.0
1600
9.0
27
3.3| D 2 O
2.416 29.7
1200
6.0
26
4.0| H 2 O
Ge
4.030 17.6
2900
13.2
17
3.2| D 2 O
4.000 17.7
600
11.0
16
3.0| D 2 O
4.010 17.4
1200
11.6
16
5.0| H 2 O
Si
3.460 20.6
2900
13.00
17
2.0| D 2 O
3.420 20.9
1600
10.6
18
3.0| D 2 O
3.420 20.5
1200
9.6
18
3.2| H 2 O
Beam convergence 5%
2.2 Application of IRRAS to the Electrochemical Interface
17
À1 . Results listed in Table 2.1 show that the highest enhancement of
the reflected p-polarized light is obtained at the angle of incidence close to the critical
angle of the window|air interface. Si and Ge have the highest values of the refractive
index and thus, the optimal angles of incidence decrease to ca 20
. At the angle of
incidence slightly smaller than the critical angle of the window|air interface, the IR
beam propagates at a grazing angle through the electrolyte (see Fig. 2.4). Thus, the
IR light is reflected from a significantly larger area of the mirror surface than the
diameter of the incoming IR beam, indicating that a large number of molecules
interacts with the IR radiation and gives contribution to IR absorption modes in the
measured IRRA spectrum.
Figures 2.5c, d shows that, at the optimal angle of incidence, the thickness of the
electrolyte layer, through which the IR light propagates, should be adjusted. The
MSEFS versus electrolyte layer thickness plots show a broad maximum for
2 < d < 6 μm.
In situ experiments at the electrochemical interface require a precise adjustment
of the optimal angle of incidence and electrolyte layer thickness (Table 2.1, Fig. 2.5)
to a thoughtfully designed spectroelectrochemical cell. In 1980 Bewick overcame
the problem of the strong IR absorption by the electrolyte with his design of a thin
electrolyte layer spectroelectrochemical cell [13, 20]. The basic design of the thin
electrolyte layer cell has not changed since 1980. Few constructional modifications
Table 2.1 The refractive index, critical angle at the optical window|electrolyte interface, calculated
maximum MSEFS of the p-polarized IR light at 2900, 1600 and 1200 cm
À1 and the corresponding
angle of incidence and electrolyte layer thickness in the following stratified media: IR window|
electrolyte|Au
Window
material
n
Critical
angle
window|
water
interface
(
)
Wavenumber
of incoming
radiation
(cm
À1
)
MSEFS max
Angle of
incidence at
MSEFS max
(
)
Electrolyte layer
thickness at
MSEFS max (μm)|
Electrolyte
CaF 2
1.416 59.5
2900
7.4
53
2.4| D 2 O
1.378 62.3
1600
4.4
60
4.4| D 2 O
BaF 2
1.459 56.7
2900
8.0
52
2.2| D 2 O
1.439 58.0
1600
5.2
60
3.2| D 2 O
1.423 57.5
1200
3.8
57
3.2| H 2 O
ZnSe
2.430 30.1
2900
11.4
28
4.0| D 2 O
2.420 30.0
1600
9.0
27
3.3| D 2 O
2.416 29.7
1200
6.0
26
4.0| H 2 O
Ge
4.030 17.6
2900
13.2
17
3.2| D 2 O
4.000 17.7
600
11.0
16
3.0| D 2 O
4.010 17.4
1200
11.6
16
5.0| H 2 O
Si
3.460 20.6
2900
13.00
17
2.0| D 2 O
3.420 20.9
1600
10.6
18
3.0| D 2 O
3.420 20.5
1200
9.6
18
3.2| H 2 O
Beam convergence 5%
2.2 Application of IRRAS to the Electrochemical Interface
17