

incidence close to the maximum, facilitating the alignment of the
spectroelectrochemical cell in the experimental set-up.
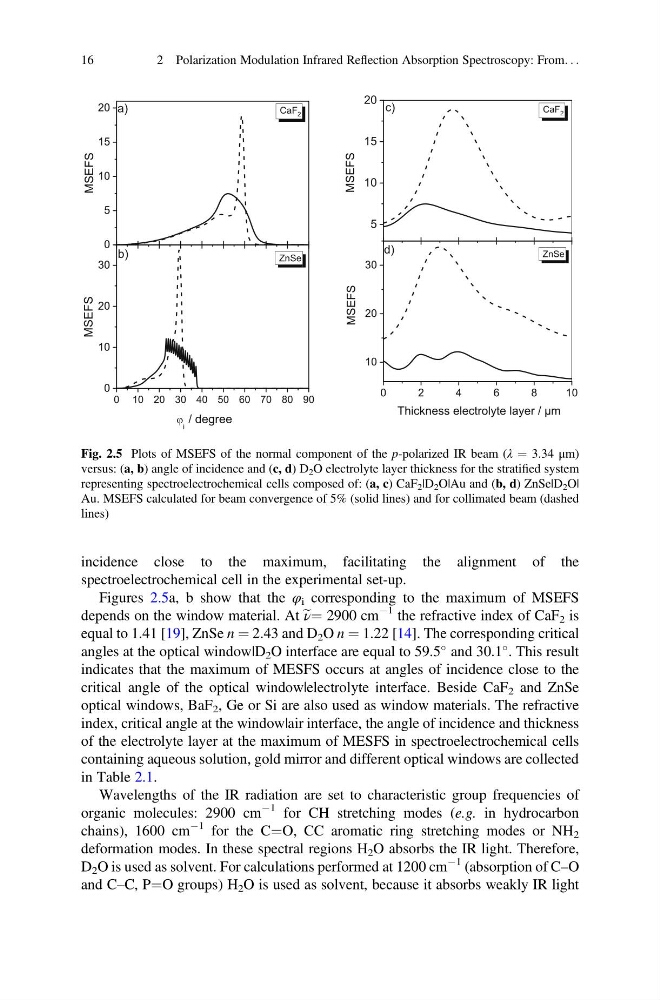
Figures 2.5a, b show that the φ i corresponding to the maximum of MSEFS
depends on the window material. At e ν¼ 2900 cm
À1 the refractive index of CaF 2 is
equal to 1.41 [19], ZnSe n ¼ 2.43 and D 2 O n ¼ 1.22 [14]. The corresponding critical
angles at the optical window|D 2 O interface are equal to 59.5
and 30.1
. This result
indicates that the maximum of MESFS occurs at angles of incidence close to the
critical angle of the optical window|electrolyte interface. Beside CaF 2 and ZnSe
optical windows, BaF 2 , Ge or Si are also used as window materials. The refractive
index, critical angle at the window|air interface, the angle of incidence and thickness
of the electrolyte layer at the maximum of MESFS in spectroelectrochemical cells
containing aqueous solution, gold mirror and different optical windows are collected
in Table 2.1.
Wavelengths of the IR radiation are set to characteristic group frequencies of
organic molecules: 2900 cm
À1 for CH stretching modes (e.g. in hydrocarbon
chains), 1600 cm
À1 for the C¼O, CC aromatic ring stretching modes or NH 2
deformation modes. In these spectral regions H 2 O absorbs the IR light. Therefore,
D 2 O is used as solvent. For calculations performed at 1200 cm
À1 (absorption of C–O
and C–C, P¼O groups) H 2 O is used as solvent, because it absorbs weakly IR light
0
5
10
15
20
0 10 20 30 40 50 60 70 80 90
0
10
20
30
MSEFS
a)
CaF 2
MSEFS
i
/ degree
b)
ZnSe
5
10
15
20
0
2
4
6
8
1 0
10
20
30
c)
MSEFS
CaF 2
d)
Thickness electrolyte layer / µm
MSEFS
ZnSe
Fig. 2.5 Plots of MSEFS of the normal component of the p-polarized IR beam (λ ¼ 3.34 μm)
versus: (a, b) angle of incidence and (c, d) D 2 O electrolyte layer thickness for the stratified system
representing spectroelectrochemical cells composed of: (a, c) CaF 2 |D 2 O|Au and (b, d) ZnSe|D 2 O|
Au. MSEFS calculated for beam convergence of 5% (solid lines) and for collimated beam (dashed
lines)
16
2 Polarization Modulation Infrared Reflection Absorption Spectroscopy: From. . .
spectroelectrochemical cell in the experimental set-up.
Figures 2.5a, b show that the φ i corresponding to the maximum of MSEFS
depends on the window material. At e ν¼ 2900 cm
À1 the refractive index of CaF 2 is
equal to 1.41 [19], ZnSe n ¼ 2.43 and D 2 O n ¼ 1.22 [14]. The corresponding critical
angles at the optical window|D 2 O interface are equal to 59.5
and 30.1
. This result
indicates that the maximum of MESFS occurs at angles of incidence close to the
critical angle of the optical window|electrolyte interface. Beside CaF 2 and ZnSe
optical windows, BaF 2 , Ge or Si are also used as window materials. The refractive
index, critical angle at the window|air interface, the angle of incidence and thickness
of the electrolyte layer at the maximum of MESFS in spectroelectrochemical cells
containing aqueous solution, gold mirror and different optical windows are collected
in Table 2.1.
Wavelengths of the IR radiation are set to characteristic group frequencies of
organic molecules: 2900 cm
À1 for CH stretching modes (e.g. in hydrocarbon
chains), 1600 cm
À1 for the C¼O, CC aromatic ring stretching modes or NH 2
deformation modes. In these spectral regions H 2 O absorbs the IR light. Therefore,
D 2 O is used as solvent. For calculations performed at 1200 cm
À1 (absorption of C–O
and C–C, P¼O groups) H 2 O is used as solvent, because it absorbs weakly IR light
0
5
10
15
20
0 10 20 30 40 50 60 70 80 90
0
10
20
30
MSEFS
a)
CaF 2
MSEFS
i
/ degree
b)
ZnSe
5
10
15
20
0
2
4
6
8
1 0
10
20
30
c)
MSEFS
CaF 2
d)
Thickness electrolyte layer / µm
MSEFS
ZnSe
Fig. 2.5 Plots of MSEFS of the normal component of the p-polarized IR beam (λ ¼ 3.34 μm)
versus: (a, b) angle of incidence and (c, d) D 2 O electrolyte layer thickness for the stratified system
representing spectroelectrochemical cells composed of: (a, c) CaF 2 |D 2 O|Au and (b, d) ZnSe|D 2 O|
Au. MSEFS calculated for beam convergence of 5% (solid lines) and for collimated beam (dashed
lines)
16
2 Polarization Modulation Infrared Reflection Absorption Spectroscopy: From. . .