

202
A. Dasgotra et al.
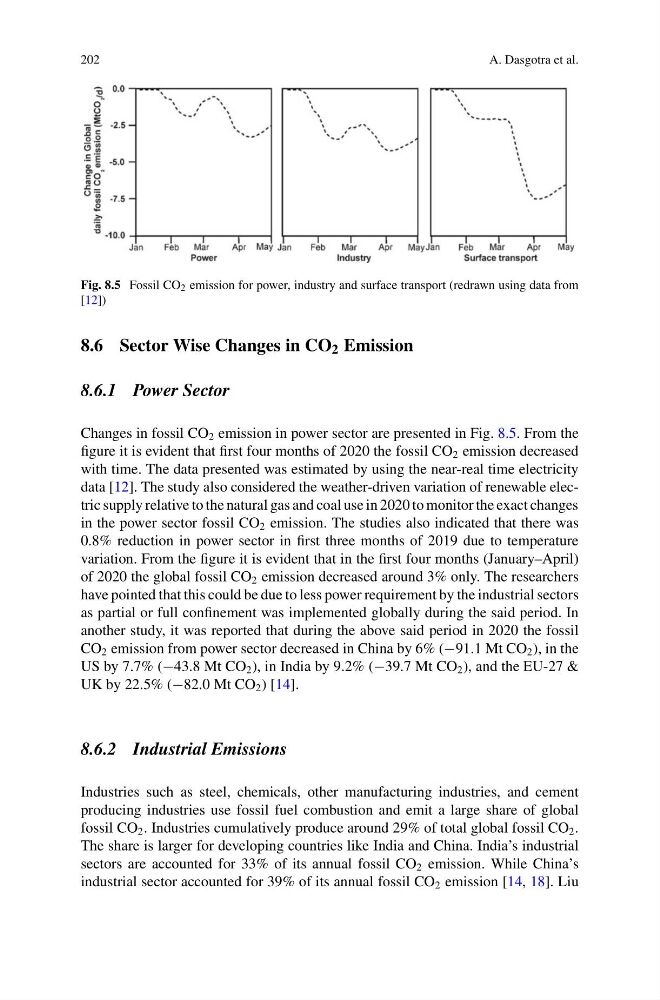
Fig. 8.5 Fossil CO 2 emission for power, industry and surface transport (redrawn using data from
[12])
8.6 Sector Wise Changes in CO 2 Emission
8.6.1 Power Sector
Changes in fossil CO 2 emission in power sector are presented in Fig. 8.5. From the
figure it is evident that first four months of 2020 the fossil CO 2 emission decreased
with time. The data presented was estimated by using the near-real time electricity
data [12]. The study also considered the weather-driven variation of renewable electric supply relative to the natural gas and coal use in 2020 to monitor the exact changes
in the power sector fossil CO 2 emission. The studies also indicated that there was
0.8% reduction in power sector in first three months of 2019 due to temperature
variation. From the figure it is evident that in the first four months (January–April)
of 2020 the global fossil CO 2 emission decreased around 3% only. The researchers
have pointed that this could be due to less power requirement by the industrial sectors
as partial or full confinement was implemented globally during the said period. In
another study, it was reported that during the above said period in 2020 the fossil
CO 2 emission from power sector decreased in China by 6% (−91.1 Mt CO 2 ), in the
US by 7.7% (−43.8 Mt CO 2 ), in India by 9.2% (−39.7 Mt CO 2 ), and the EU-27 &
UK by 22.5% (−82.0 Mt CO 2 ) [14].
8.6.2 Industrial Emissions
Industries such as steel, chemicals, other manufacturing industries, and cement
producing industries use fossil fuel combustion and emit a large share of global
fossil CO 2 . Industries cumulatively produce around 29% of total global fossil CO 2 .
The share is larger for developing countries like India and China. India’s industrial
sectors are accounted for 33% of its annual fossil CO 2 emission. While China’s
industrial sector accounted for 39% of its annual fossil CO 2 emission [14, 18]. Liu
A. Dasgotra et al.
Fig. 8.5 Fossil CO 2 emission for power, industry and surface transport (redrawn using data from
[12])
8.6 Sector Wise Changes in CO 2 Emission
8.6.1 Power Sector
Changes in fossil CO 2 emission in power sector are presented in Fig. 8.5. From the
figure it is evident that first four months of 2020 the fossil CO 2 emission decreased
with time. The data presented was estimated by using the near-real time electricity
data [12]. The study also considered the weather-driven variation of renewable electric supply relative to the natural gas and coal use in 2020 to monitor the exact changes
in the power sector fossil CO 2 emission. The studies also indicated that there was
0.8% reduction in power sector in first three months of 2019 due to temperature
variation. From the figure it is evident that in the first four months (January–April)
of 2020 the global fossil CO 2 emission decreased around 3% only. The researchers
have pointed that this could be due to less power requirement by the industrial sectors
as partial or full confinement was implemented globally during the said period. In
another study, it was reported that during the above said period in 2020 the fossil
CO 2 emission from power sector decreased in China by 6% (−91.1 Mt CO 2 ), in the
US by 7.7% (−43.8 Mt CO 2 ), in India by 9.2% (−39.7 Mt CO 2 ), and the EU-27 &
UK by 22.5% (−82.0 Mt CO 2 ) [14].
8.6.2 Industrial Emissions
Industries such as steel, chemicals, other manufacturing industries, and cement
producing industries use fossil fuel combustion and emit a large share of global
fossil CO 2 . Industries cumulatively produce around 29% of total global fossil CO 2 .
The share is larger for developing countries like India and China. India’s industrial
sectors are accounted for 33% of its annual fossil CO 2 emission. While China’s
industrial sector accounted for 39% of its annual fossil CO 2 emission [14, 18]. Liu