

8 COVID-19 and Its Impact on Carbon Dioxide Emissions
203
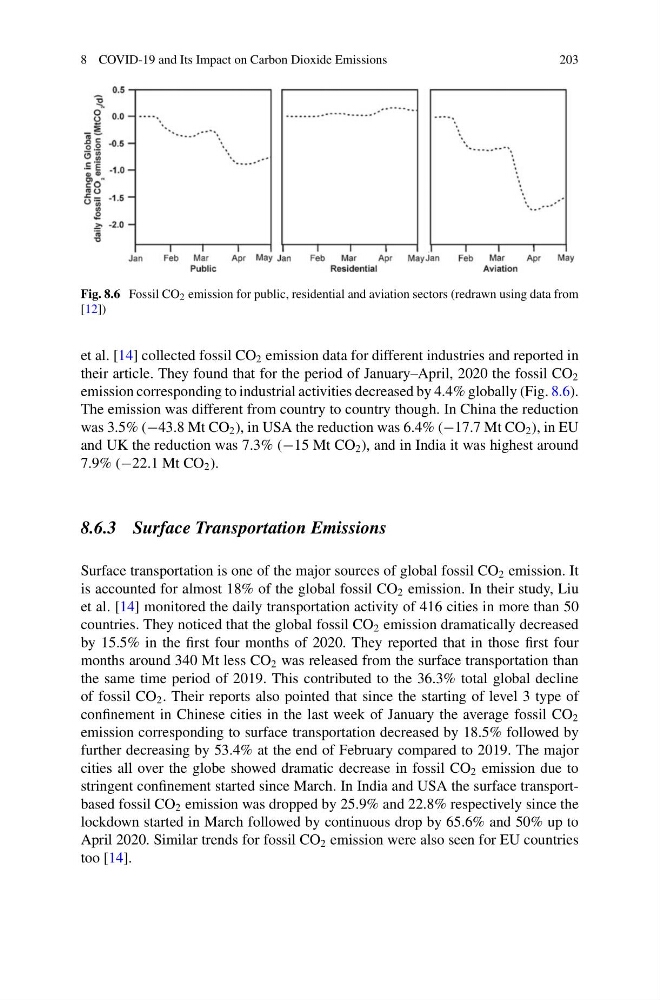
Fig. 8.6 Fossil CO 2 emission for public, residential and aviation sectors (redrawn using data from
[12])
et al. [14] collected fossil CO 2 emission data for different industries and reported in
their article. They found that for the period of January–April, 2020 the fossil CO 2
emission corresponding to industrial activities decreased by 4.4% globally (Fig. 8.6).
The emission was different from country to country though. In China the reduction
was 3.5% (−43.8 Mt CO 2 ), in USA the reduction was 6.4% (−17.7 Mt CO 2 ), in EU
and UK the reduction was 7.3% (−15 Mt CO 2 ), and in India it was highest around
7.9% (−22.1 Mt CO 2 ).
8.6.3 Surface Transportation Emissions
Surface transportation is one of the major sources of global fossil CO 2 emission. It
is accounted for almost 18% of the global fossil CO 2 emission. In their study, Liu
et al. [14] monitored the daily transportation activity of 416 cities in more than 50
countries. They noticed that the global fossil CO 2 emission dramatically decreased
by 15.5% in the first four months of 2020. They reported that in those first four
months around 340 Mt less CO 2 was released from the surface transportation than
the same time period of 2019. This contributed to the 36.3% total global decline
of fossil CO 2 . Their reports also pointed that since the starting of level 3 type of
confinement in Chinese cities in the last week of January the average fossil CO 2
emission corresponding to surface transportation decreased by 18.5% followed by
further decreasing by 53.4% at the end of February compared to 2019. The major
cities all over the globe showed dramatic decrease in fossil CO 2 emission due to
stringent confinement started since March. In India and USA the surface transportbased fossil CO 2 emission was dropped by 25.9% and 22.8% respectively since the
lockdown started in March followed by continuous drop by 65.6% and 50% up to
April 2020. Similar trends for fossil CO 2 emission were also seen for EU countries
too [14].
203
Fig. 8.6 Fossil CO 2 emission for public, residential and aviation sectors (redrawn using data from
[12])
et al. [14] collected fossil CO 2 emission data for different industries and reported in
their article. They found that for the period of January–April, 2020 the fossil CO 2
emission corresponding to industrial activities decreased by 4.4% globally (Fig. 8.6).
The emission was different from country to country though. In China the reduction
was 3.5% (−43.8 Mt CO 2 ), in USA the reduction was 6.4% (−17.7 Mt CO 2 ), in EU
and UK the reduction was 7.3% (−15 Mt CO 2 ), and in India it was highest around
7.9% (−22.1 Mt CO 2 ).
8.6.3 Surface Transportation Emissions
Surface transportation is one of the major sources of global fossil CO 2 emission. It
is accounted for almost 18% of the global fossil CO 2 emission. In their study, Liu
et al. [14] monitored the daily transportation activity of 416 cities in more than 50
countries. They noticed that the global fossil CO 2 emission dramatically decreased
by 15.5% in the first four months of 2020. They reported that in those first four
months around 340 Mt less CO 2 was released from the surface transportation than
the same time period of 2019. This contributed to the 36.3% total global decline
of fossil CO 2 . Their reports also pointed that since the starting of level 3 type of
confinement in Chinese cities in the last week of January the average fossil CO 2
emission corresponding to surface transportation decreased by 18.5% followed by
further decreasing by 53.4% at the end of February compared to 2019. The major
cities all over the globe showed dramatic decrease in fossil CO 2 emission due to
stringent confinement started since March. In India and USA the surface transportbased fossil CO 2 emission was dropped by 25.9% and 22.8% respectively since the
lockdown started in March followed by continuous drop by 65.6% and 50% up to
April 2020. Similar trends for fossil CO 2 emission were also seen for EU countries
too [14].