

8 COVID-19 and Its Impact on Carbon Dioxide Emissions
201
8.5 Changes in CO 2 Emission at Global Level
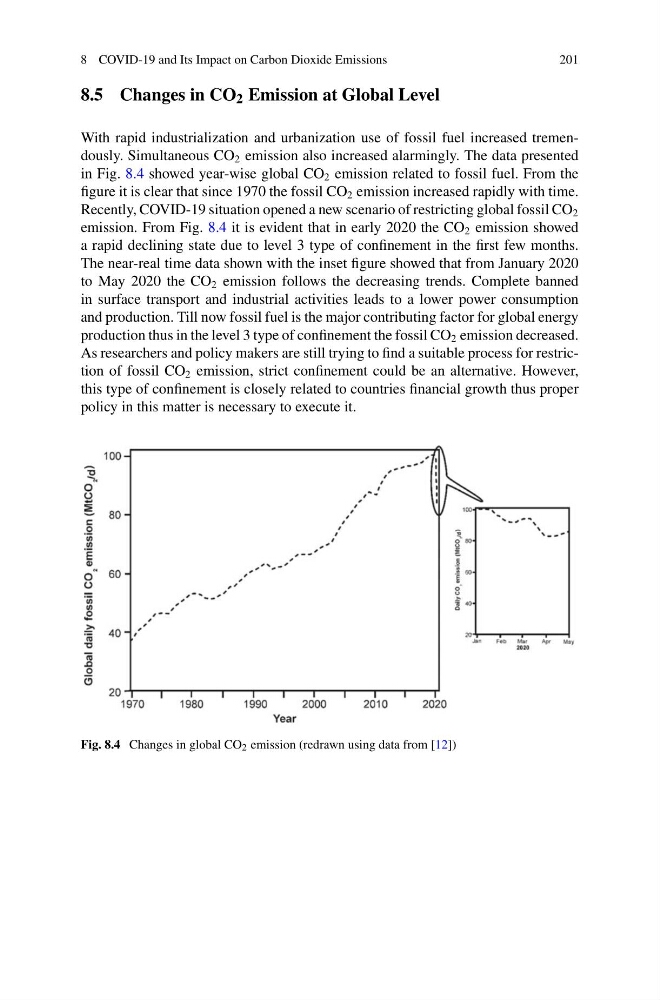
With rapid industrialization and urbanization use of fossil fuel increased tremendously. Simultaneous CO 2 emission also increased alarmingly. The data presented
in Fig. 8.4 showed year-wise global CO 2 emission related to fossil fuel. From the
figure it is clear that since 1970 the fossil CO 2 emission increased rapidly with time.
Recently, COVID-19 situation opened a new scenario of restricting global fossil CO 2
emission. From Fig. 8.4 it is evident that in early 2020 the CO 2 emission showed
a rapid declining state due to level 3 type of confinement in the first few months.
The near-real time data shown with the inset figure showed that from January 2020
to May 2020 the CO 2 emission follows the decreasing trends. Complete banned
in surface transport and industrial activities leads to a lower power consumption
and production. Till now fossil fuel is the major contributing factor for global energy
production thus in the level 3 type of confinement the fossil CO 2 emission decreased.
As researchers and policy makers are still trying to find a suitable process for restriction of fossil CO 2 emission, strict confinement could be an alternative. However,
this type of confinement is closely related to countries financial growth thus proper
policy in this matter is necessary to execute it.
Fig. 8.4 Changes in global CO 2 emission (redrawn using data from [12])
201
8.5 Changes in CO 2 Emission at Global Level
With rapid industrialization and urbanization use of fossil fuel increased tremendously. Simultaneous CO 2 emission also increased alarmingly. The data presented
in Fig. 8.4 showed year-wise global CO 2 emission related to fossil fuel. From the
figure it is clear that since 1970 the fossil CO 2 emission increased rapidly with time.
Recently, COVID-19 situation opened a new scenario of restricting global fossil CO 2
emission. From Fig. 8.4 it is evident that in early 2020 the CO 2 emission showed
a rapid declining state due to level 3 type of confinement in the first few months.
The near-real time data shown with the inset figure showed that from January 2020
to May 2020 the CO 2 emission follows the decreasing trends. Complete banned
in surface transport and industrial activities leads to a lower power consumption
and production. Till now fossil fuel is the major contributing factor for global energy
production thus in the level 3 type of confinement the fossil CO 2 emission decreased.
As researchers and policy makers are still trying to find a suitable process for restriction of fossil CO 2 emission, strict confinement could be an alternative. However,
this type of confinement is closely related to countries financial growth thus proper
policy in this matter is necessary to execute it.
Fig. 8.4 Changes in global CO 2 emission (redrawn using data from [12])