

150
R. S. Sharma et al.
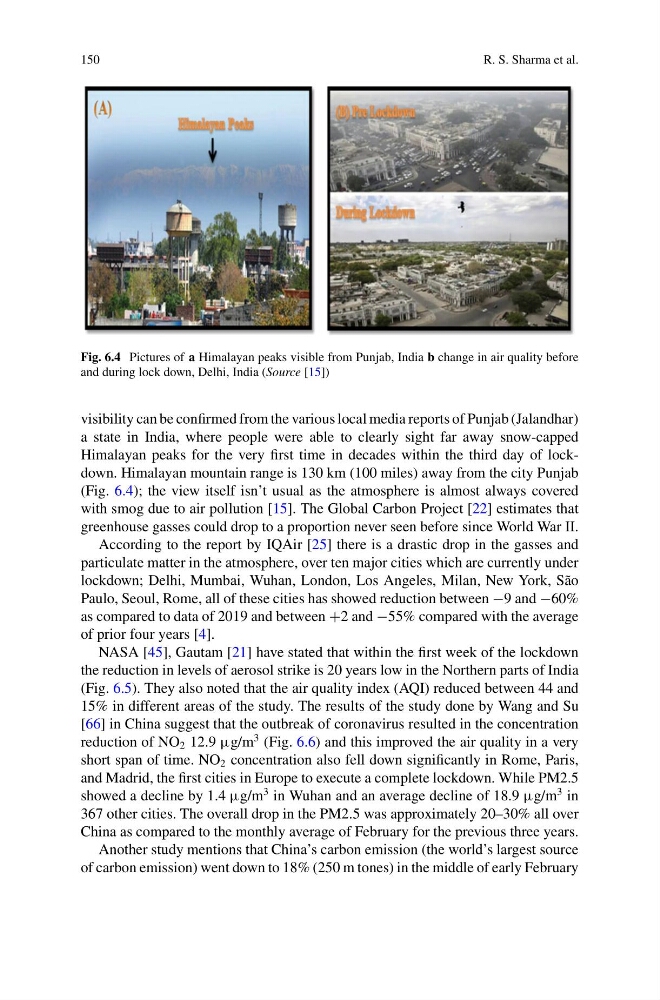
Fig. 6.4 Pictures of a Himalayan peaks visible from Punjab, India b change in air quality before
and during lock down, Delhi, India (Source [15])
visibility can be confirmed from the various local media reports of Punjab (Jalandhar)
a state in India, where people were able to clearly sight far away snow-capped
Himalayan peaks for the very first time in decades within the third day of lockdown. Himalayan mountain range is 130 km (100 miles) away from the city Punjab
(Fig. 6.4); the view itself isn’t usual as the atmosphere is almost always covered
with smog due to air pollution [15]. The Global Carbon Project [22] estimates that
greenhouse gasses could drop to a proportion never seen before since World War II.
According to the report by IQAir [25] there is a drastic drop in the gasses and
particulate matter in the atmosphere, over ten major cities which are currently under
lockdown; Delhi, Mumbai, Wuhan, London, Los Angeles, Milan, New York, São
Paulo, Seoul, Rome, all of these cities has showed reduction between −9 and −60%
as compared to data of 2019 and between +2 and −55% compared with the average
of prior four years [4].
NASA [45], Gautam [21] have stated that within the first week of the lockdown
the reduction in levels of aerosol strike is 20 years low in the Northern parts of India
(Fig. 6.5). They also noted that the air quality index (AQI) reduced between 44 and
15% in different areas of the study. The results of the study done by Wang and Su
[66] in China suggest that the outbreak of coronavirus resulted in the concentration
reduction of NO 2 12.9 µg/m
3 (Fig. 6.6) and this improved the air quality in a very
short span of time. NO 2 concentration also fell down significantly in Rome, Paris,
and Madrid, the first cities in Europe to execute a complete lockdown. While PM2.5
showed a decline by 1.4 µg/m
3 in Wuhan and an average decline of 18.9 µg/m
3 in
367 other cities. The overall drop in the PM2.5 was approximately 20–30% all over
China as compared to the monthly average of February for the previous three years.
Another study mentions that China’s carbon emission (the world’s largest source
of carbon emission) went down to 18% (250 m tones) in the middle of early February
R. S. Sharma et al.
Fig. 6.4 Pictures of a Himalayan peaks visible from Punjab, India b change in air quality before
and during lock down, Delhi, India (Source [15])
visibility can be confirmed from the various local media reports of Punjab (Jalandhar)
a state in India, where people were able to clearly sight far away snow-capped
Himalayan peaks for the very first time in decades within the third day of lockdown. Himalayan mountain range is 130 km (100 miles) away from the city Punjab
(Fig. 6.4); the view itself isn’t usual as the atmosphere is almost always covered
with smog due to air pollution [15]. The Global Carbon Project [22] estimates that
greenhouse gasses could drop to a proportion never seen before since World War II.
According to the report by IQAir [25] there is a drastic drop in the gasses and
particulate matter in the atmosphere, over ten major cities which are currently under
lockdown; Delhi, Mumbai, Wuhan, London, Los Angeles, Milan, New York, São
Paulo, Seoul, Rome, all of these cities has showed reduction between −9 and −60%
as compared to data of 2019 and between +2 and −55% compared with the average
of prior four years [4].
NASA [45], Gautam [21] have stated that within the first week of the lockdown
the reduction in levels of aerosol strike is 20 years low in the Northern parts of India
(Fig. 6.5). They also noted that the air quality index (AQI) reduced between 44 and
15% in different areas of the study. The results of the study done by Wang and Su
[66] in China suggest that the outbreak of coronavirus resulted in the concentration
reduction of NO 2 12.9 µg/m
3 (Fig. 6.6) and this improved the air quality in a very
short span of time. NO 2 concentration also fell down significantly in Rome, Paris,
and Madrid, the first cities in Europe to execute a complete lockdown. While PM2.5
showed a decline by 1.4 µg/m
3 in Wuhan and an average decline of 18.9 µg/m
3 in
367 other cities. The overall drop in the PM2.5 was approximately 20–30% all over
China as compared to the monthly average of February for the previous three years.
Another study mentions that China’s carbon emission (the world’s largest source
of carbon emission) went down to 18% (250 m tones) in the middle of early February