

6 Aftermath of Industrial Pollution, Post COVID-19 …
151
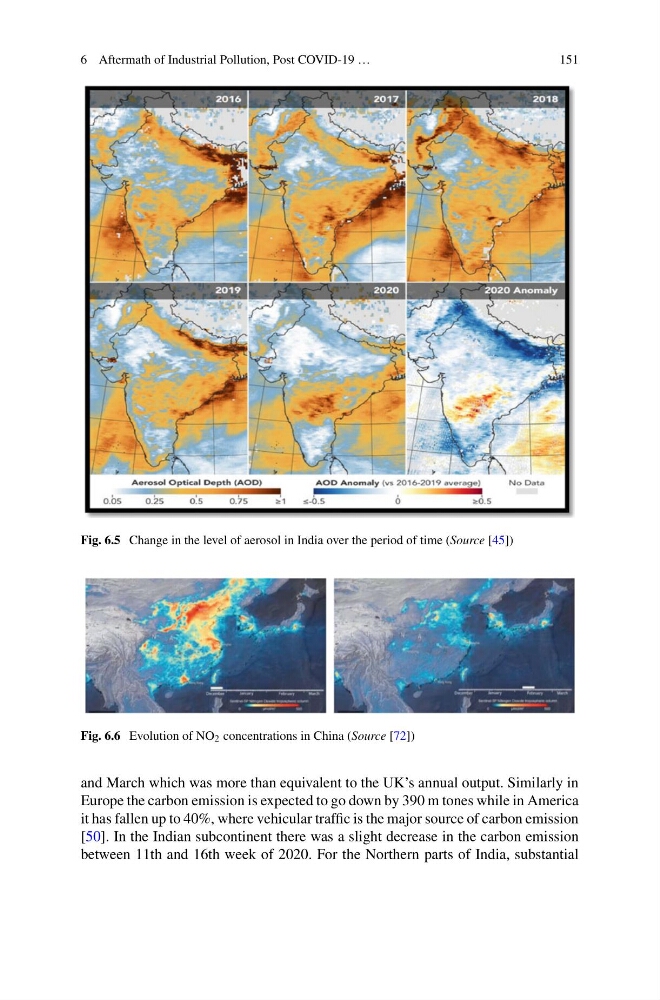
Fig. 6.5 Change in the level of aerosol in India over the period of time (Source [45])
Fig. 6.6 Evolution of NO 2 concentrations in China (Source [72])
and March which was more than equivalent to the UK’s annual output. Similarly in
Europe the carbon emission is expected to go down by 390 m tones while in America
it has fallen up to 40%, where vehicular traffic is the major source of carbon emission
[50]. In the Indian subcontinent there was a slight decrease in the carbon emission
between 11th and 16th week of 2020. For the Northern parts of India, substantial
151
Fig. 6.5 Change in the level of aerosol in India over the period of time (Source [45])
Fig. 6.6 Evolution of NO 2 concentrations in China (Source [72])
and March which was more than equivalent to the UK’s annual output. Similarly in
Europe the carbon emission is expected to go down by 390 m tones while in America
it has fallen up to 40%, where vehicular traffic is the major source of carbon emission
[50]. In the Indian subcontinent there was a slight decrease in the carbon emission
between 11th and 16th week of 2020. For the Northern parts of India, substantial