

5 The Dual Impact of Lockdown on Curbing COVID-19 Spread …
125
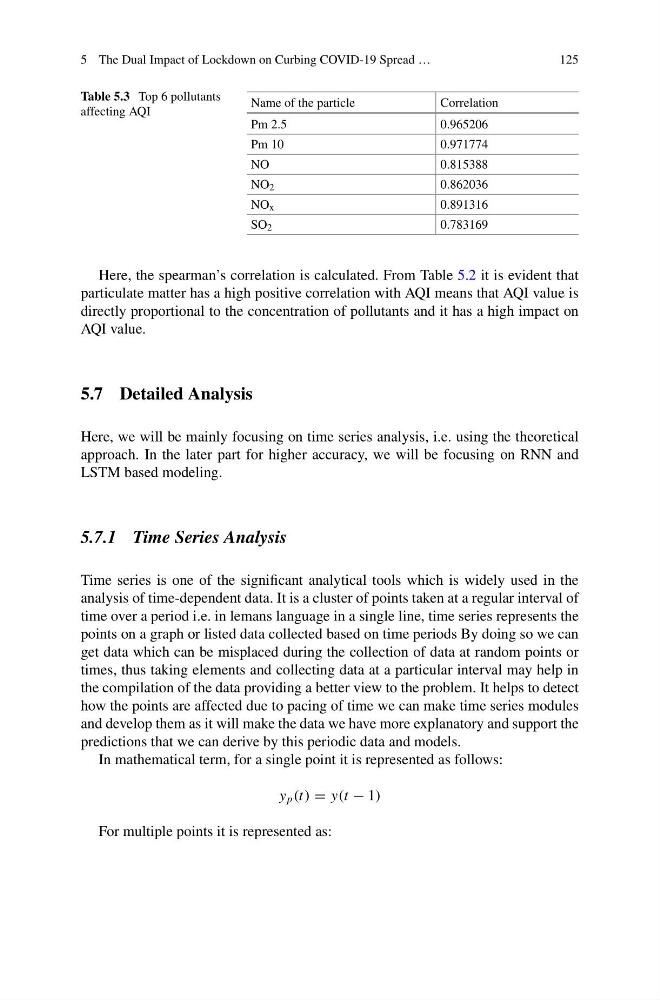
Table 5.3 Top 6 pollutants
affecting AQI
Name of the particle
Correlation
Pm 2.5
0.965206
Pm 10
0.971774
NO
0.815388
NO 2
0.862036
NO x
0.891316
SO 2
0.783169
Here, the spearman’s correlation is calculated. From Table 5.2 it is evident that
particulate matter has a high positive correlation with AQI means that AQI value is
directly proportional to the concentration of pollutants and it has a high impact on
AQI value.
5.7 Detailed Analysis
Here, we will be mainly focusing on time series analysis, i.e. using the theoretical
approach. In the later part for higher accuracy, we will be focusing on RNN and
LSTM based modeling.
5.7.1 Time Series Analysis
Time series is one of the significant analytical tools which is widely used in the
analysis of time-dependent data. It is a cluster of points taken at a regular interval of
time over a period i.e. in lemans language in a single line, time series represents the
points on a graph or listed data collected based on time periods By doing so we can
get data which can be misplaced during the collection of data at random points or
times, thus taking elements and collecting data at a particular interval may help in
the compilation of the data providing a better view to the problem. It helps to detect
how the points are affected due to pacing of time we can make time series modules
and develop them as it will make the data we have more explanatory and support the
predictions that we can derive by this periodic data and models.
In mathematical term, for a single point it is represented as follows:
y p (t) = y(t − 1)
For multiple points it is represented as:
125
Table 5.3 Top 6 pollutants
affecting AQI
Name of the particle
Correlation
Pm 2.5
0.965206
Pm 10
0.971774
NO
0.815388
NO 2
0.862036
NO x
0.891316
SO 2
0.783169
Here, the spearman’s correlation is calculated. From Table 5.2 it is evident that
particulate matter has a high positive correlation with AQI means that AQI value is
directly proportional to the concentration of pollutants and it has a high impact on
AQI value.
5.7 Detailed Analysis
Here, we will be mainly focusing on time series analysis, i.e. using the theoretical
approach. In the later part for higher accuracy, we will be focusing on RNN and
LSTM based modeling.
5.7.1 Time Series Analysis
Time series is one of the significant analytical tools which is widely used in the
analysis of time-dependent data. It is a cluster of points taken at a regular interval of
time over a period i.e. in lemans language in a single line, time series represents the
points on a graph or listed data collected based on time periods By doing so we can
get data which can be misplaced during the collection of data at random points or
times, thus taking elements and collecting data at a particular interval may help in
the compilation of the data providing a better view to the problem. It helps to detect
how the points are affected due to pacing of time we can make time series modules
and develop them as it will make the data we have more explanatory and support the
predictions that we can derive by this periodic data and models.
In mathematical term, for a single point it is represented as follows:
y p (t) = y(t − 1)
For multiple points it is represented as: