

124
S. Roy and A. Chatterjee
From Household works:
Still today in many houses, cooking is done using the burning of biomass and kerosene
which is a high source of pollution. Also, emission of CFC from AC and fridges
causes a lot of pollution. These are some of the sources of indoor air pollution. Also
RSPM, SPM is one of the key pollutants of household pollution.
5.5 Dataset Preparation
The dataset has been taken from Kaggle, IQAir, air-quality.com, aqicn and other
different sources. The AQI value and concentration of other pollutants from June
2018 to June 2020 is taken into account. Doing basic analysis, we can conclude that
AQI value changes with the season as during festival time, i.e. from September end
to February end. There are numerous number of festivals and lighting of crackers
promotes the rise in the value of AQI and this value again gets down from March to
August. Also, it is observed that AQI is directly proportional to the concentration of
the pollutants but each pollutant has a different contributing factor. This is further
elaborated in the next section.[31, 32]
5.6 Understanding Basic Relationship of Pollutants
with Pollution
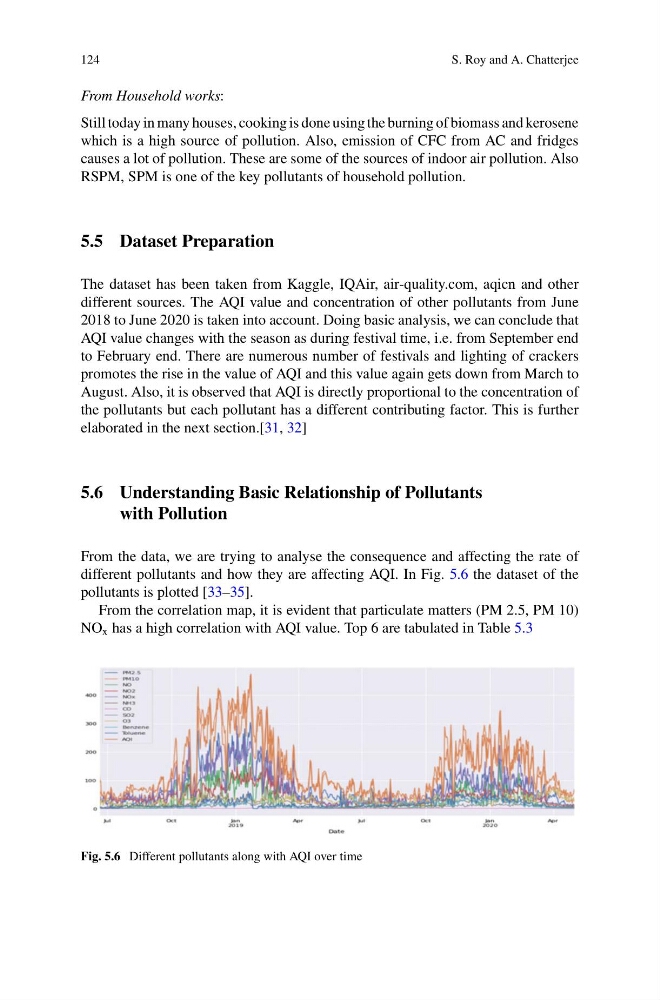
From the data, we are trying to analyse the consequence and affecting the rate of
different pollutants and how they are affecting AQI. In Fig. 5.6 the dataset of the
pollutants is plotted [33–35].
From the correlation map, it is evident that particulate matters (PM 2.5, PM 10)
NO x has a high correlation with AQI value. Top 6 are tabulated in Table 5.3
Fig. 5.6 Different pollutants along with AQI over time
S. Roy and A. Chatterjee
From Household works:
Still today in many houses, cooking is done using the burning of biomass and kerosene
which is a high source of pollution. Also, emission of CFC from AC and fridges
causes a lot of pollution. These are some of the sources of indoor air pollution. Also
RSPM, SPM is one of the key pollutants of household pollution.
5.5 Dataset Preparation
The dataset has been taken from Kaggle, IQAir, air-quality.com, aqicn and other
different sources. The AQI value and concentration of other pollutants from June
2018 to June 2020 is taken into account. Doing basic analysis, we can conclude that
AQI value changes with the season as during festival time, i.e. from September end
to February end. There are numerous number of festivals and lighting of crackers
promotes the rise in the value of AQI and this value again gets down from March to
August. Also, it is observed that AQI is directly proportional to the concentration of
the pollutants but each pollutant has a different contributing factor. This is further
elaborated in the next section.[31, 32]
5.6 Understanding Basic Relationship of Pollutants
with Pollution
From the data, we are trying to analyse the consequence and affecting the rate of
different pollutants and how they are affecting AQI. In Fig. 5.6 the dataset of the
pollutants is plotted [33–35].
From the correlation map, it is evident that particulate matters (PM 2.5, PM 10)
NO x has a high correlation with AQI value. Top 6 are tabulated in Table 5.3
Fig. 5.6 Different pollutants along with AQI over time