

than when using the original NREL assay on the same biomass
(Fig. 4) even without any additional optimization for each species.
This suggested that further comprehensive optimization of the
assay for each individual species might liberate even higher total
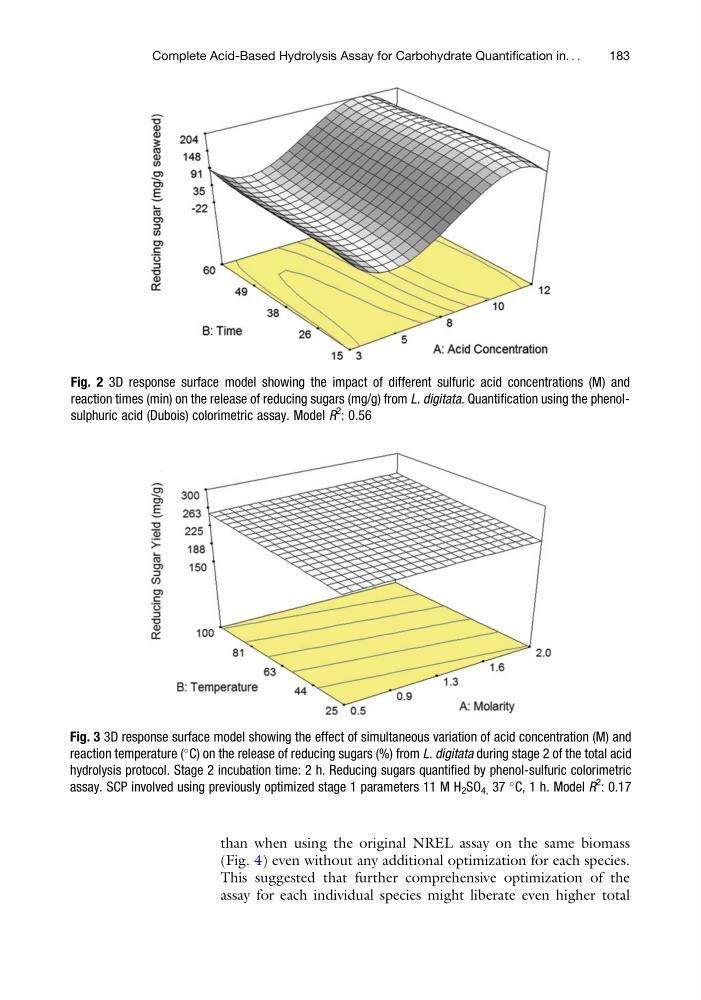
Fig. 2 3D response surface model showing the impact of different sulfuric acid concentrations (M) and
reaction times (min) on the release of reducing sugars (mg/g) from L. digitata. Quantification using the phenolsulphuric acid (Dubois) colorimetric assay. Model R
2
: 0.56
Fig. 3 3D response surface model showing the effect of simultaneous variation of acid concentration (M) and
reaction temperature (
C) on the release of reducing sugars (%) from L. digitata during stage 2 of the total acid
hydrolysis protocol. Stage 2 incubation time: 2 h. Reducing sugars quantified by phenol-sulfuric colorimetric
assay. SCP involved using previously optimized stage 1 parameters 11 M H 2 SO 4, 37
C, 1 h. Model R
2
: 0.17
Complete Acid-Based Hydrolysis Assay for Carbohydrate Quantification in. . .
183
(Fig. 4) even without any additional optimization for each species.
This suggested that further comprehensive optimization of the
assay for each individual species might liberate even higher total
Fig. 2 3D response surface model showing the impact of different sulfuric acid concentrations (M) and
reaction times (min) on the release of reducing sugars (mg/g) from L. digitata. Quantification using the phenolsulphuric acid (Dubois) colorimetric assay. Model R
2
: 0.56
Fig. 3 3D response surface model showing the effect of simultaneous variation of acid concentration (M) and
reaction temperature (
C) on the release of reducing sugars (%) from L. digitata during stage 2 of the total acid
hydrolysis protocol. Stage 2 incubation time: 2 h. Reducing sugars quantified by phenol-sulfuric colorimetric
assay. SCP involved using previously optimized stage 1 parameters 11 M H 2 SO 4, 37
C, 1 h. Model R
2
: 0.17
Complete Acid-Based Hydrolysis Assay for Carbohydrate Quantification in. . .
183