

4.2 Results of the Validation
73
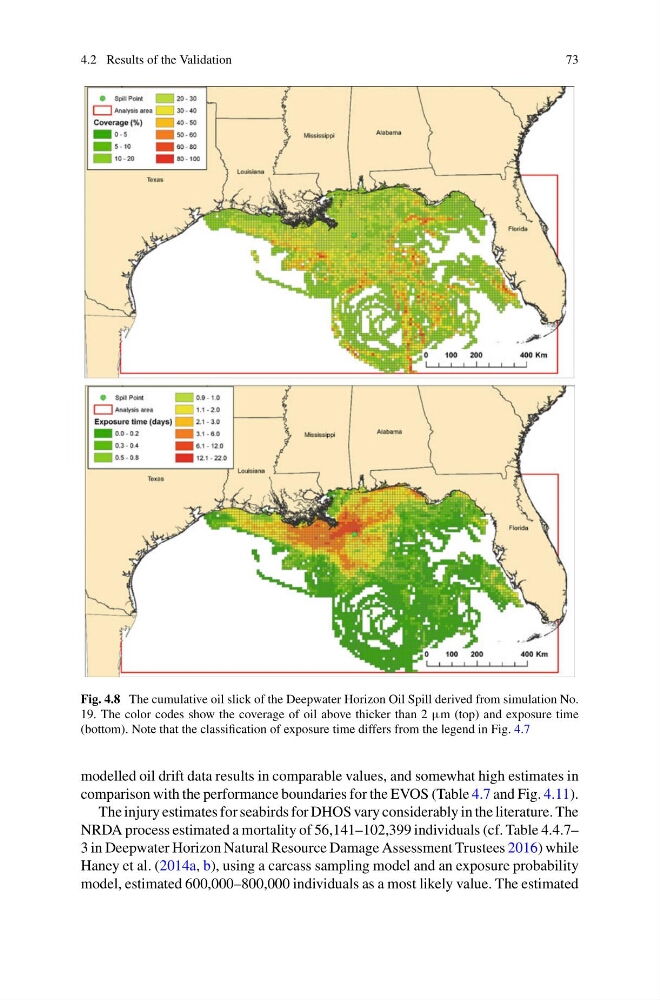
Fig. 4.8 The cumulative oil slick of the Deepwater Horizon Oil Spill derived from simulation No.
19. The color codes show the coverage of oil above thicker than 2 µm (top) and exposure time
(bottom). Note that the classification of exposure time differs from the legend in Fig. 4.7
modelled oil drift data results in comparable values, and somewhat high estimates in
comparison with the performance boundaries for the EVOS (Table 4.7 and Fig. 4.11).
The injury estimates for seabirds for DHOS vary considerably in the literature. The
NRDA process estimated a mortality of 56,141–102,399 individuals (cf. Table 4.4.7–
3 in Deepwater Horizon Natural Resource Damage Assessment Trustees 2016) while
Haney et al. (2014a, b), using a carcass sampling model and an exposure probability
model, estimated 600,000–800,000 individuals as a most likely value. The estimated
73
Fig. 4.8 The cumulative oil slick of the Deepwater Horizon Oil Spill derived from simulation No.
19. The color codes show the coverage of oil above thicker than 2 µm (top) and exposure time
(bottom). Note that the classification of exposure time differs from the legend in Fig. 4.7
modelled oil drift data results in comparable values, and somewhat high estimates in
comparison with the performance boundaries for the EVOS (Table 4.7 and Fig. 4.11).
The injury estimates for seabirds for DHOS vary considerably in the literature. The
NRDA process estimated a mortality of 56,141–102,399 individuals (cf. Table 4.4.7–
3 in Deepwater Horizon Natural Resource Damage Assessment Trustees 2016) while
Haney et al. (2014a, b), using a carcass sampling model and an exposure probability
model, estimated 600,000–800,000 individuals as a most likely value. The estimated