

74
4 Testing and Validating Against Historic Spills
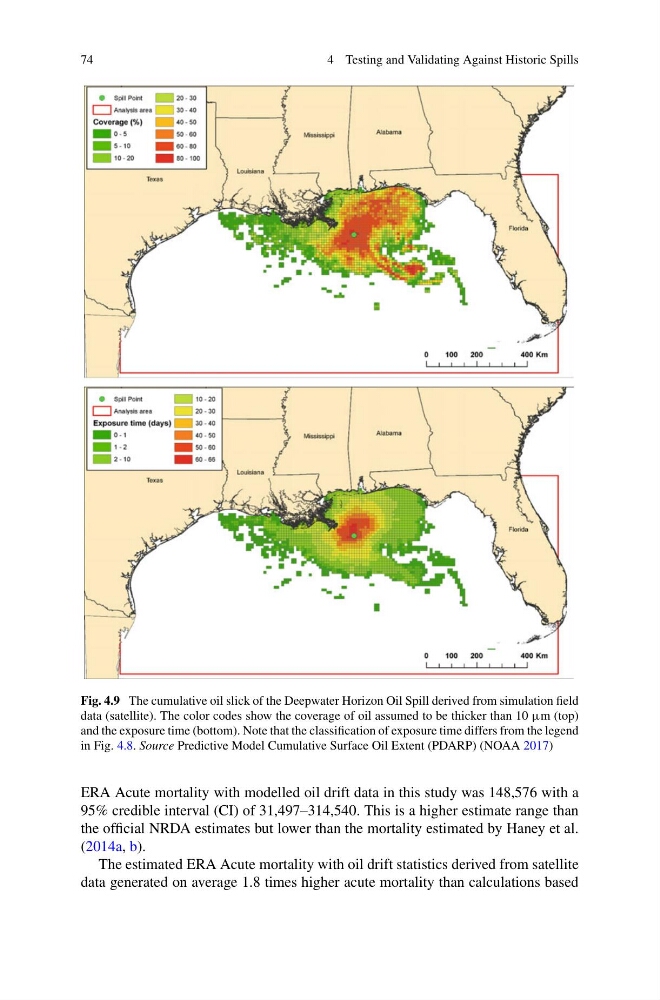
Fig. 4.9 The cumulative oil slick of the Deepwater Horizon Oil Spill derived from simulation field
data (satellite). The color codes show the coverage of oil assumed to be thicker than 10 µm (top)
and the exposure time (bottom). Note that the classification of exposure time differs from the legend
in Fig. 4.8. Source Predictive Model Cumulative Surface Oil Extent (PDARP) (NOAA 2017)
ERA Acute mortality with modelled oil drift data in this study was 148,576 with a
95% credible interval (CI) of 31,497–314,540. This is a higher estimate range than
the official NRDA estimates but lower than the mortality estimated by Haney et al.
(2014a, b).
The estimated ERA Acute mortality with oil drift statistics derived from satellite
data generated on average 1.8 times higher acute mortality than calculations based
4 Testing and Validating Against Historic Spills
Fig. 4.9 The cumulative oil slick of the Deepwater Horizon Oil Spill derived from simulation field
data (satellite). The color codes show the coverage of oil assumed to be thicker than 10 µm (top)
and the exposure time (bottom). Note that the classification of exposure time differs from the legend
in Fig. 4.8. Source Predictive Model Cumulative Surface Oil Extent (PDARP) (NOAA 2017)
ERA Acute mortality with modelled oil drift data in this study was 148,576 with a
95% credible interval (CI) of 31,497–314,540. This is a higher estimate range than
the official NRDA estimates but lower than the mortality estimated by Haney et al.
(2014a, b).
The estimated ERA Acute mortality with oil drift statistics derived from satellite
data generated on average 1.8 times higher acute mortality than calculations based