

4.2 Results of the Validation
71
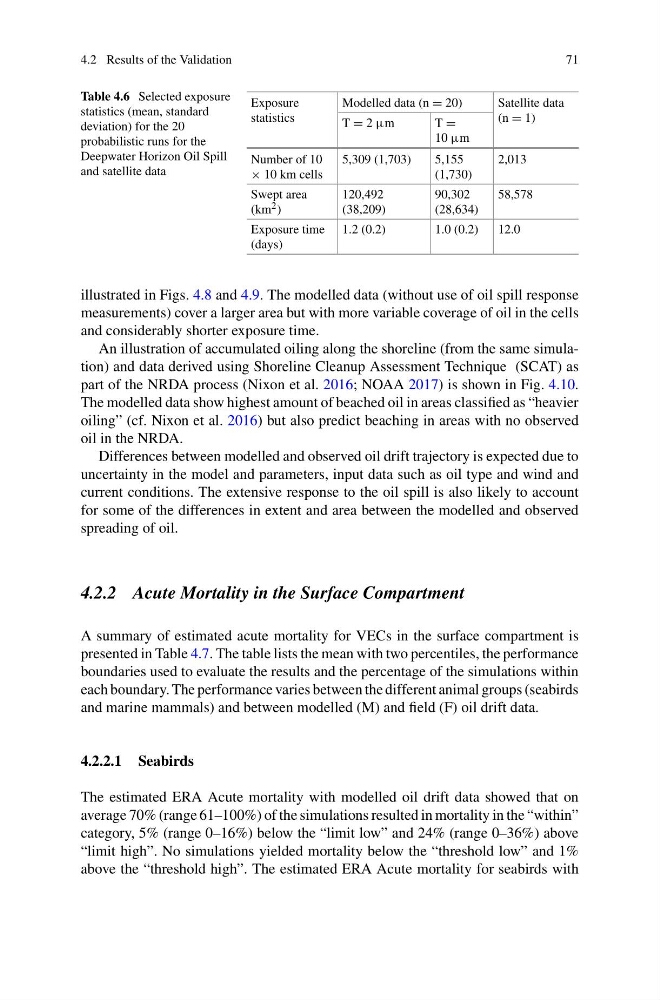
Table 4.6 Selected exposure
statistics (mean, standard
deviation) for the 20
probabilistic runs for the
Deepwater Horizon Oil Spill
and satellite data
Exposure
statistics
Modelled data (n = 20)
Satellite data
(n = 1)
T = 2 µm
T =
10 µm
Number of 10
× 10 km cells
5,309 (1,703)
5,155
(1,730)
2,013
Swept area
(km 2 )
120,492
(38,209)
90,302
(28,634)
58,578
Exposure time
(days)
1.2 (0.2)
1.0 (0.2)
12.0
illustrated in Figs. 4.8 and 4.9. The modelled data (without use of oil spill response
measurements) cover a larger area but with more variable coverage of oil in the cells
and considerably shorter exposure time.
An illustration of accumulated oiling along the shoreline (from the same simulation) and data derived using Shoreline Cleanup Assessment Technique (SCAT) as
part of the NRDA process (Nixon et al. 2016; NOAA 2017) is shown in Fig. 4.10.
The modelled data show highest amount of beached oil in areas classified as “heavier
oiling” (cf. Nixon et al. 2016) but also predict beaching in areas with no observed
oil in the NRDA.
Differences between modelled and observed oil drift trajectory is expected due to
uncertainty in the model and parameters, input data such as oil type and wind and
current conditions. The extensive response to the oil spill is also likely to account
for some of the differences in extent and area between the modelled and observed
spreading of oil.
4.2.2 Acute Mortality in the Surface Compartment
A summary of estimated acute mortality for VECs in the surface compartment is
presented in Table 4.7. The table lists the mean with two percentiles, the performance
boundaries used to evaluate the results and the percentage of the simulations within
each boundary. The performance varies between the different animal groups (seabirds
and marine mammals) and between modelled (M) and field (F) oil drift data.
4.2.2.1 Seabirds
The estimated ERA Acute mortality with modelled oil drift data showed that on
average 70% (range 61–100%) of the simulations resulted in mortality in the “within”
category, 5% (range 0–16%) below the “limit low” and 24% (range 0–36%) above
“limit high”. No simulations yielded mortality below the “threshold low” and 1%
above the “threshold high”. The estimated ERA Acute mortality for seabirds with
71
Table 4.6 Selected exposure
statistics (mean, standard
deviation) for the 20
probabilistic runs for the
Deepwater Horizon Oil Spill
and satellite data
Exposure
statistics
Modelled data (n = 20)
Satellite data
(n = 1)
T = 2 µm
T =
10 µm
Number of 10
× 10 km cells
5,309 (1,703)
5,155
(1,730)
2,013
Swept area
(km 2 )
120,492
(38,209)
90,302
(28,634)
58,578
Exposure time
(days)
1.2 (0.2)
1.0 (0.2)
12.0
illustrated in Figs. 4.8 and 4.9. The modelled data (without use of oil spill response
measurements) cover a larger area but with more variable coverage of oil in the cells
and considerably shorter exposure time.
An illustration of accumulated oiling along the shoreline (from the same simulation) and data derived using Shoreline Cleanup Assessment Technique (SCAT) as
part of the NRDA process (Nixon et al. 2016; NOAA 2017) is shown in Fig. 4.10.
The modelled data show highest amount of beached oil in areas classified as “heavier
oiling” (cf. Nixon et al. 2016) but also predict beaching in areas with no observed
oil in the NRDA.
Differences between modelled and observed oil drift trajectory is expected due to
uncertainty in the model and parameters, input data such as oil type and wind and
current conditions. The extensive response to the oil spill is also likely to account
for some of the differences in extent and area between the modelled and observed
spreading of oil.
4.2.2 Acute Mortality in the Surface Compartment
A summary of estimated acute mortality for VECs in the surface compartment is
presented in Table 4.7. The table lists the mean with two percentiles, the performance
boundaries used to evaluate the results and the percentage of the simulations within
each boundary. The performance varies between the different animal groups (seabirds
and marine mammals) and between modelled (M) and field (F) oil drift data.
4.2.2.1 Seabirds
The estimated ERA Acute mortality with modelled oil drift data showed that on
average 70% (range 61–100%) of the simulations resulted in mortality in the “within”
category, 5% (range 0–16%) below the “limit low” and 24% (range 0–36%) above
“limit high”. No simulations yielded mortality below the “threshold low” and 1%
above the “threshold high”. The estimated ERA Acute mortality for seabirds with