

70
4 Testing and Validating Against Historic Spills
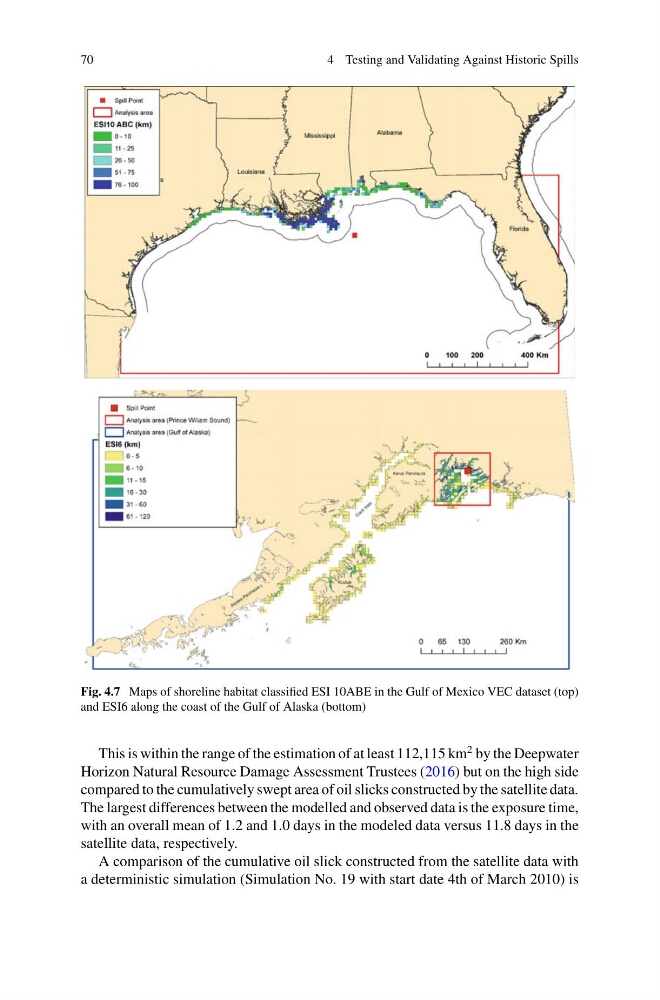
Fig. 4.7 Maps of shoreline habitat classified ESI 10ABE in the Gulf of Mexico VEC dataset (top)
and ESI6 along the coast of the Gulf of Alaska (bottom)
This is within the range of the estimation of at least 112,115 km
2 by the Deepwater
Horizon Natural Resource Damage Assessment Trustees (2016) but on the high side
compared to the cumulatively swept area of oil slicks constructed by the satellite data.
The largest differences between the modelled and observed data is the exposure time,
with an overall mean of 1.2 and 1.0 days in the modeled data versus 11.8 days in the
satellite data, respectively.
A comparison of the cumulative oil slick constructed from the satellite data with
a deterministic simulation (Simulation No. 19 with start date 4th of March 2010) is
4 Testing and Validating Against Historic Spills
Fig. 4.7 Maps of shoreline habitat classified ESI 10ABE in the Gulf of Mexico VEC dataset (top)
and ESI6 along the coast of the Gulf of Alaska (bottom)
This is within the range of the estimation of at least 112,115 km
2 by the Deepwater
Horizon Natural Resource Damage Assessment Trustees (2016) but on the high side
compared to the cumulatively swept area of oil slicks constructed by the satellite data.
The largest differences between the modelled and observed data is the exposure time,
with an overall mean of 1.2 and 1.0 days in the modeled data versus 11.8 days in the
satellite data, respectively.
A comparison of the cumulative oil slick constructed from the satellite data with
a deterministic simulation (Simulation No. 19 with start date 4th of March 2010) is