

4.1 Method of Validation Against Historic Spills
65
and chemical fates model that computes and records the distribution of oil on the sea
surface, along the shorelines, in the water column and on the seafloor.
A total of 20 single simulations were performed with start dates within the seasonal
time window of the two oil spills. A single simulation was performed for the DHOS
case to obtain concentration of oil in the sediment. All oil drift simulations extended
for 20 days after the release had been stopped.
4.1.3.2 Satellite Data Approach
The trajectory for the DHOS was reconstructed based on field surveys and satellite
datasets. For the sea surface we used the dataset “Predictive Model Cumulative
Surface Oil Extent (PDARP)” (NOAA 2017). The dataset included daily prediction
of surface oil coverage from a period of 90 days with satellite observations between
23rd of April and 11th of August 2010. The data were mapped onto the UTM grid
file for the DHOS and the time averaged coverage and exposure time for each 10 ×
10 km grid cell in the analysis area was calculated.
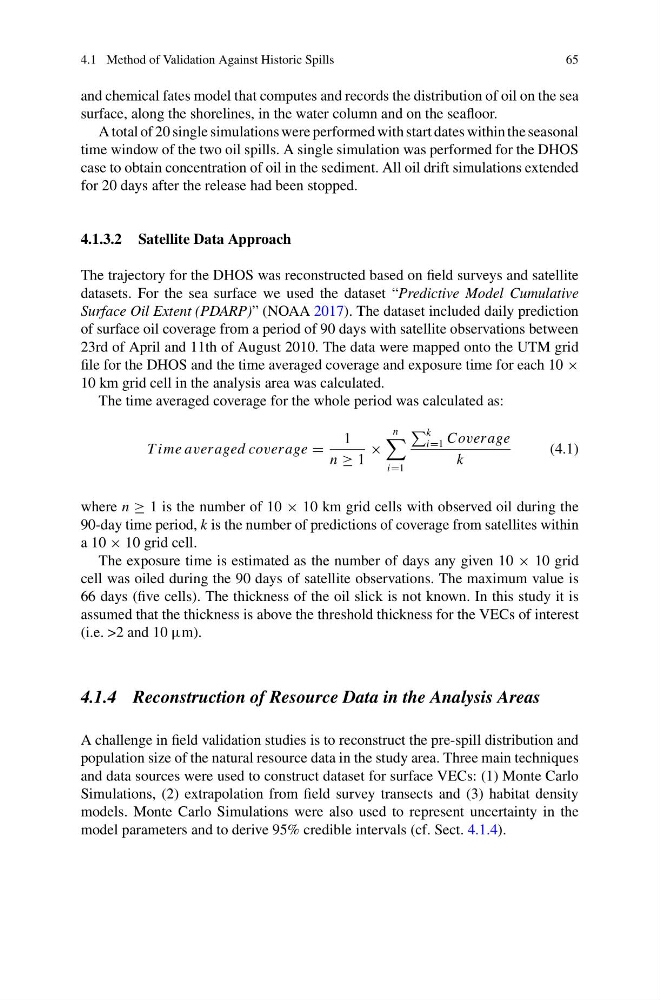
The time averaged coverage for the whole period was calculated as:
T ime averaged coverage =
1
n ≥ 1
×
n
i=1
k
i=1 Coverage
k
(4.1)
where n ≥ 1 is the number of 10 × 10 km grid cells with observed oil during the
90-day time period, k is the number of predictions of coverage from satellites within
a 10 × 10 grid cell.
The exposure time is estimated as the number of days any given 10 × 10 grid
cell was oiled during the 90 days of satellite observations. The maximum value is
66 days (five cells). The thickness of the oil slick is not known. In this study it is
assumed that the thickness is above the threshold thickness for the VECs of interest
(i.e. >2 and 10 µm).
4.1.4 Reconstruction of Resource Data in the Analysis Areas
A challenge in field validation studies is to reconstruct the pre-spill distribution and
population size of the natural resource data in the study area. Three main techniques
and data sources were used to construct dataset for surface VECs: (1) Monte Carlo
Simulations, (2) extrapolation from field survey transects and (3) habitat density
models. Monte Carlo Simulations were also used to represent uncertainty in the
model parameters and to derive 95% credible intervals (cf. Sect. 4.1.4).
65
and chemical fates model that computes and records the distribution of oil on the sea
surface, along the shorelines, in the water column and on the seafloor.
A total of 20 single simulations were performed with start dates within the seasonal
time window of the two oil spills. A single simulation was performed for the DHOS
case to obtain concentration of oil in the sediment. All oil drift simulations extended
for 20 days after the release had been stopped.
4.1.3.2 Satellite Data Approach
The trajectory for the DHOS was reconstructed based on field surveys and satellite
datasets. For the sea surface we used the dataset “Predictive Model Cumulative
Surface Oil Extent (PDARP)” (NOAA 2017). The dataset included daily prediction
of surface oil coverage from a period of 90 days with satellite observations between
23rd of April and 11th of August 2010. The data were mapped onto the UTM grid
file for the DHOS and the time averaged coverage and exposure time for each 10 ×
10 km grid cell in the analysis area was calculated.
The time averaged coverage for the whole period was calculated as:
T ime averaged coverage =
1
n ≥ 1
×
n
i=1
k
i=1 Coverage
k
(4.1)
where n ≥ 1 is the number of 10 × 10 km grid cells with observed oil during the
90-day time period, k is the number of predictions of coverage from satellites within
a 10 × 10 grid cell.
The exposure time is estimated as the number of days any given 10 × 10 grid
cell was oiled during the 90 days of satellite observations. The maximum value is
66 days (five cells). The thickness of the oil slick is not known. In this study it is
assumed that the thickness is above the threshold thickness for the VECs of interest
(i.e. >2 and 10 µm).
4.1.4 Reconstruction of Resource Data in the Analysis Areas
A challenge in field validation studies is to reconstruct the pre-spill distribution and
population size of the natural resource data in the study area. Three main techniques
and data sources were used to construct dataset for surface VECs: (1) Monte Carlo
Simulations, (2) extrapolation from field survey transects and (3) habitat density
models. Monte Carlo Simulations were also used to represent uncertainty in the
model parameters and to derive 95% credible intervals (cf. Sect. 4.1.4).