

64
4 Testing and Validating Against Historic Spills
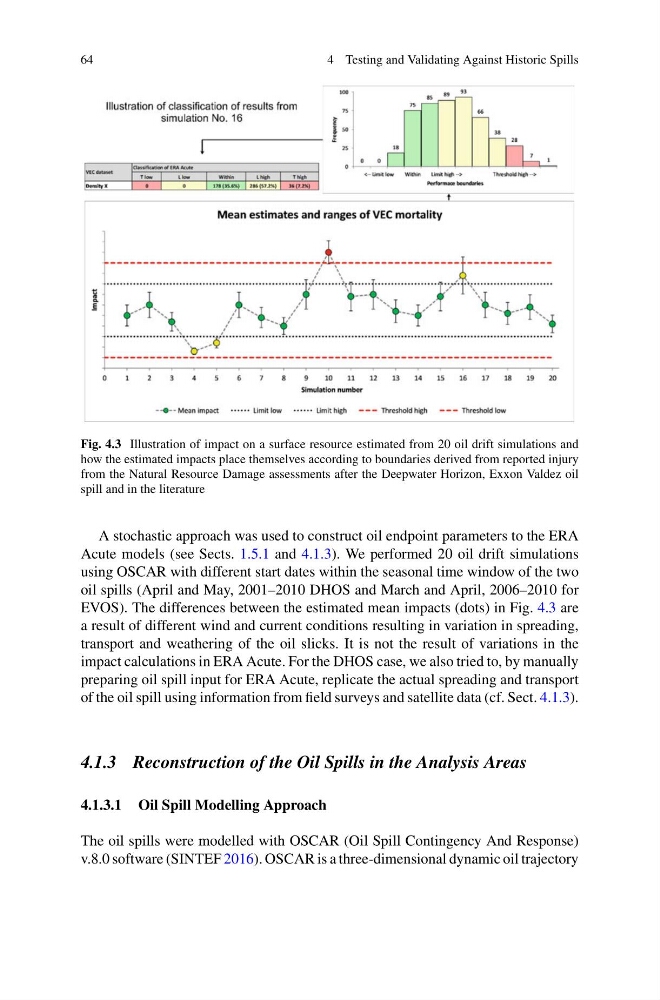
Fig. 4.3 Illustration of impact on a surface resource estimated from 20 oil drift simulations and
how the estimated impacts place themselves according to boundaries derived from reported injury
from the Natural Resource Damage assessments after the Deepwater Horizon, Exxon Valdez oil
spill and in the literature
A stochastic approach was used to construct oil endpoint parameters to the ERA
Acute models (see Sects. 1.5.1 and 4.1.3). We performed 20 oil drift simulations
using OSCAR with different start dates within the seasonal time window of the two
oil spills (April and May, 2001–2010 DHOS and March and April, 2006–2010 for
EVOS). The differences between the estimated mean impacts (dots) in Fig. 4.3 are
a result of different wind and current conditions resulting in variation in spreading,
transport and weathering of the oil slicks. It is not the result of variations in the
impact calculations in ERA Acute. For the DHOS case, we also tried to, by manually
preparing oil spill input for ERA Acute, replicate the actual spreading and transport
of the oil spill using information from field surveys and satellite data (cf. Sect. 4.1.3).
4.1.3 Reconstruction of the Oil Spills in the Analysis Areas
4.1.3.1 Oil Spill Modelling Approach
The oil spills were modelled with OSCAR (Oil Spill Contingency And Response)
v.8.0 software (SINTEF 2016). OSCAR is a three-dimensional dynamic oil trajectory
4 Testing and Validating Against Historic Spills
Fig. 4.3 Illustration of impact on a surface resource estimated from 20 oil drift simulations and
how the estimated impacts place themselves according to boundaries derived from reported injury
from the Natural Resource Damage assessments after the Deepwater Horizon, Exxon Valdez oil
spill and in the literature
A stochastic approach was used to construct oil endpoint parameters to the ERA
Acute models (see Sects. 1.5.1 and 4.1.3). We performed 20 oil drift simulations
using OSCAR with different start dates within the seasonal time window of the two
oil spills (April and May, 2001–2010 DHOS and March and April, 2006–2010 for
EVOS). The differences between the estimated mean impacts (dots) in Fig. 4.3 are
a result of different wind and current conditions resulting in variation in spreading,
transport and weathering of the oil slicks. It is not the result of variations in the
impact calculations in ERA Acute. For the DHOS case, we also tried to, by manually
preparing oil spill input for ERA Acute, replicate the actual spreading and transport
of the oil spill using information from field surveys and satellite data (cf. Sect. 4.1.3).
4.1.3 Reconstruction of the Oil Spills in the Analysis Areas
4.1.3.1 Oil Spill Modelling Approach
The oil spills were modelled with OSCAR (Oil Spill Contingency And Response)
v.8.0 software (SINTEF 2016). OSCAR is a three-dimensional dynamic oil trajectory