

4.1 Method of Validation Against Historic Spills
63
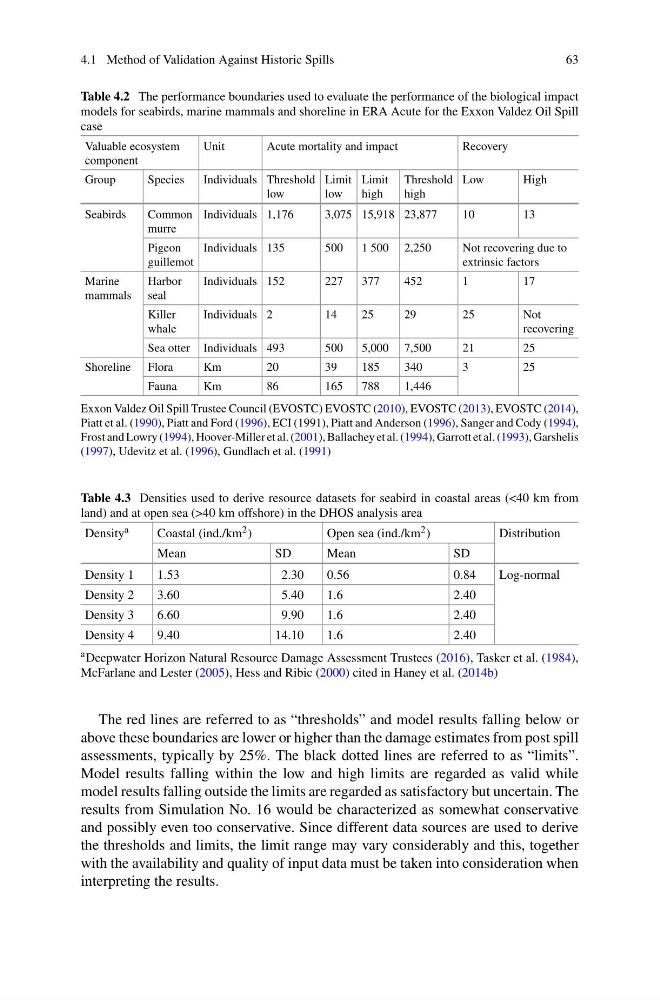
Table 4.2 The performance boundaries used to evaluate the performance of the biological impact
models for seabirds, marine mammals and shoreline in ERA Acute for the Exxon Valdez Oil Spill
case
Valuable ecosystem
component
Unit
Acute mortality and impact
Recovery
Group
Species
Individuals Threshold
low
Limit
low
Limit
high
Threshold
high
Low
High
Seabirds
Common
murre
Individuals 1,176
3,075 15,918 23,877
10
13
Pigeon
guillemot
Individuals 135
500
1 500 2,250
Not recovering due to
extrinsic factors
Marine
mammals
Harbor
seal
Individuals 152
227
377
452
1
17
Killer
whale
Individuals 2
14
25
29
25
Not
recovering
Sea otter Individuals 493
500
5,000 7,500
21
25
Shoreline Flora
Km
20
39
185
340
3
25
Fauna
Km
86
165
788
1,446
Exxon Valdez Oil Spill Trustee Council (EVOSTC) EVOSTC (2010), EVOSTC (2013), EVOSTC (2014),
Piatt et al. (1990), Piatt and Ford (1996), ECI (1991), Piatt and Anderson (1996), Sanger and Cody (1994),
Frost and Lowry (1994), Hoover-Miller et al. (2001), Ballachey et al. (1994), Garrott et al. (1993), Garshelis
(1997), Udevitz et al. (1996), Gundlach et al. (1991)
Table 4.3 Densities used to derive resource datasets for seabird in coastal areas (<40 km from
land) and at open sea (>40 km offshore) in the DHOS analysis area
Density a
Coastal (ind./km 2 )
Open sea (ind./km 2 )
Distribution
Mean
SD
Mean
SD
Density 1
1.53
2.30
0.56
0.84
Log-normal
Density 2
3.60
5.40
1.6
2.40
Density 3
6.60
9.90
1.6
2.40
Density 4
9.40
14.10
1.6
2.40
a Deepwater Horizon Natural Resource Damage Assessment Trustees (2016), Tasker et al. (1984),
McFarlane and Lester (2005), Hess and Ribic (2000) cited in Haney et al. (2014b)
The red lines are referred to as “thresholds” and model results falling below or
above these boundaries are lower or higher than the damage estimates from post spill
assessments, typically by 25%. The black dotted lines are referred to as “limits”.
Model results falling within the low and high limits are regarded as valid while
model results falling outside the limits are regarded as satisfactory but uncertain. The
results from Simulation No. 16 would be characterized as somewhat conservative
and possibly even too conservative. Since different data sources are used to derive
the thresholds and limits, the limit range may vary considerably and this, together
with the availability and quality of input data must be taken into consideration when
interpreting the results.
63
Table 4.2 The performance boundaries used to evaluate the performance of the biological impact
models for seabirds, marine mammals and shoreline in ERA Acute for the Exxon Valdez Oil Spill
case
Valuable ecosystem
component
Unit
Acute mortality and impact
Recovery
Group
Species
Individuals Threshold
low
Limit
low
Limit
high
Threshold
high
Low
High
Seabirds
Common
murre
Individuals 1,176
3,075 15,918 23,877
10
13
Pigeon
guillemot
Individuals 135
500
1 500 2,250
Not recovering due to
extrinsic factors
Marine
mammals
Harbor
seal
Individuals 152
227
377
452
1
17
Killer
whale
Individuals 2
14
25
29
25
Not
recovering
Sea otter Individuals 493
500
5,000 7,500
21
25
Shoreline Flora
Km
20
39
185
340
3
25
Fauna
Km
86
165
788
1,446
Exxon Valdez Oil Spill Trustee Council (EVOSTC) EVOSTC (2010), EVOSTC (2013), EVOSTC (2014),
Piatt et al. (1990), Piatt and Ford (1996), ECI (1991), Piatt and Anderson (1996), Sanger and Cody (1994),
Frost and Lowry (1994), Hoover-Miller et al. (2001), Ballachey et al. (1994), Garrott et al. (1993), Garshelis
(1997), Udevitz et al. (1996), Gundlach et al. (1991)
Table 4.3 Densities used to derive resource datasets for seabird in coastal areas (<40 km from
land) and at open sea (>40 km offshore) in the DHOS analysis area
Density a
Coastal (ind./km 2 )
Open sea (ind./km 2 )
Distribution
Mean
SD
Mean
SD
Density 1
1.53
2.30
0.56
0.84
Log-normal
Density 2
3.60
5.40
1.6
2.40
Density 3
6.60
9.90
1.6
2.40
Density 4
9.40
14.10
1.6
2.40
a Deepwater Horizon Natural Resource Damage Assessment Trustees (2016), Tasker et al. (1984),
McFarlane and Lester (2005), Hess and Ribic (2000) cited in Haney et al. (2014b)
The red lines are referred to as “thresholds” and model results falling below or
above these boundaries are lower or higher than the damage estimates from post spill
assessments, typically by 25%. The black dotted lines are referred to as “limits”.
Model results falling within the low and high limits are regarded as valid while
model results falling outside the limits are regarded as satisfactory but uncertain. The
results from Simulation No. 16 would be characterized as somewhat conservative
and possibly even too conservative. Since different data sources are used to derive
the thresholds and limits, the limit range may vary considerably and this, together
with the availability and quality of input data must be taken into consideration when
interpreting the results.