

62
4 Testing and Validating Against Historic Spills
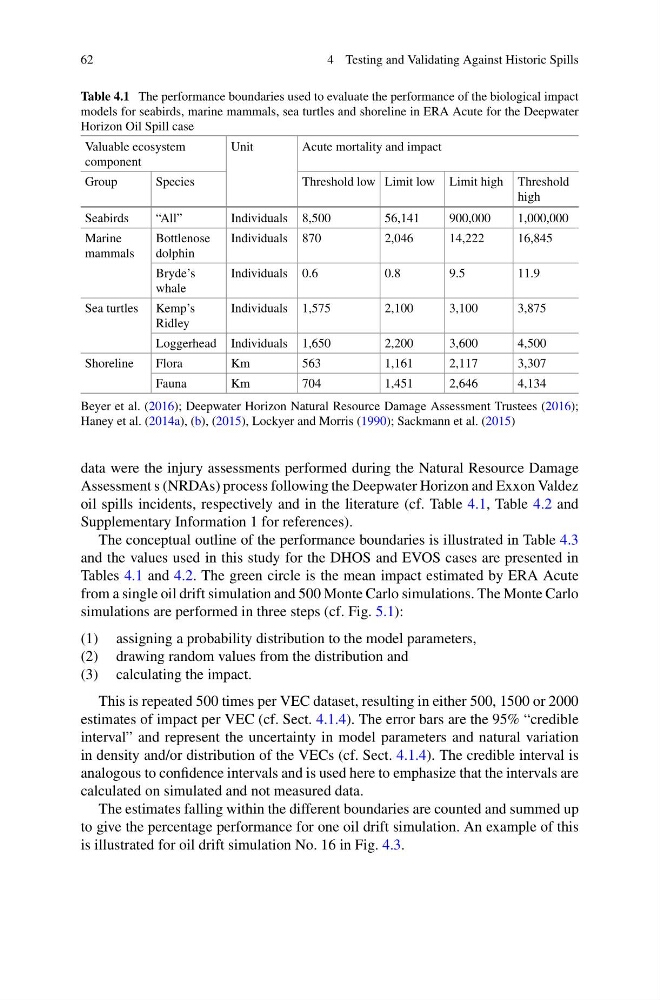
Table 4.1 The performance boundaries used to evaluate the performance of the biological impact
models for seabirds, marine mammals, sea turtles and shoreline in ERA Acute for the Deepwater
Horizon Oil Spill case
Valuable ecosystem
component
Unit
Acute mortality and impact
Group
Species
Threshold low Limit low Limit high Threshold
high
Seabirds
“All”
Individuals 8,500
56,141
900,000
1,000,000
Marine
mammals
Bottlenose
dolphin
Individuals 870
2,046
14,222
16,845
Bryde’s
whale
Individuals 0.6
0.8
9.5
11.9
Sea turtles Kemp’s
Ridley
Individuals 1,575
2,100
3,100
3,875
Loggerhead Individuals 1,650
2,200
3,600
4,500
Shoreline
Flora
Km
563
1,161
2,117
3,307
Fauna
Km
704
1,451
2,646
4,134
Beyer et al. (2016); Deepwater Horizon Natural Resource Damage Assessment Trustees (2016);
Haney et al. (2014a), (b), (2015), Lockyer and Morris (1990); Sackmann et al. (2015)
data were the injury assessments performed during the Natural Resource Damage
Assessment s (NRDAs) process following the Deepwater Horizon and Exxon Valdez
oil spills incidents, respectively and in the literature (cf. Table 4.1, Table 4.2 and
Supplementary Information 1 for references).
The conceptual outline of the performance boundaries is illustrated in Table 4.3
and the values used in this study for the DHOS and EVOS cases are presented in
Tables 4.1 and 4.2. The green circle is the mean impact estimated by ERA Acute
from a single oil drift simulation and 500 Monte Carlo simulations. The Monte Carlo
simulations are performed in three steps (cf. Fig. 5.1):
(1) assigning a probability distribution to the model parameters,
(2) drawing random values from the distribution and
(3) calculating the impact.
This is repeated 500 times per VEC dataset, resulting in either 500, 1500 or 2000
estimates of impact per VEC (cf. Sect. 4.1.4). The error bars are the 95% “credible
interval” and represent the uncertainty in model parameters and natural variation
in density and/or distribution of the VECs (cf. Sect. 4.1.4). The credible interval is
analogous to confidence intervals and is used here to emphasize that the intervals are
calculated on simulated and not measured data.
The estimates falling within the different boundaries are counted and summed up
to give the percentage performance for one oil drift simulation. An example of this
is illustrated for oil drift simulation No. 16 in Fig. 4.3.
4 Testing and Validating Against Historic Spills
Table 4.1 The performance boundaries used to evaluate the performance of the biological impact
models for seabirds, marine mammals, sea turtles and shoreline in ERA Acute for the Deepwater
Horizon Oil Spill case
Valuable ecosystem
component
Unit
Acute mortality and impact
Group
Species
Threshold low Limit low Limit high Threshold
high
Seabirds
“All”
Individuals 8,500
56,141
900,000
1,000,000
Marine
mammals
Bottlenose
dolphin
Individuals 870
2,046
14,222
16,845
Bryde’s
whale
Individuals 0.6
0.8
9.5
11.9
Sea turtles Kemp’s
Ridley
Individuals 1,575
2,100
3,100
3,875
Loggerhead Individuals 1,650
2,200
3,600
4,500
Shoreline
Flora
Km
563
1,161
2,117
3,307
Fauna
Km
704
1,451
2,646
4,134
Beyer et al. (2016); Deepwater Horizon Natural Resource Damage Assessment Trustees (2016);
Haney et al. (2014a), (b), (2015), Lockyer and Morris (1990); Sackmann et al. (2015)
data were the injury assessments performed during the Natural Resource Damage
Assessment s (NRDAs) process following the Deepwater Horizon and Exxon Valdez
oil spills incidents, respectively and in the literature (cf. Table 4.1, Table 4.2 and
Supplementary Information 1 for references).
The conceptual outline of the performance boundaries is illustrated in Table 4.3
and the values used in this study for the DHOS and EVOS cases are presented in
Tables 4.1 and 4.2. The green circle is the mean impact estimated by ERA Acute
from a single oil drift simulation and 500 Monte Carlo simulations. The Monte Carlo
simulations are performed in three steps (cf. Fig. 5.1):
(1) assigning a probability distribution to the model parameters,
(2) drawing random values from the distribution and
(3) calculating the impact.
This is repeated 500 times per VEC dataset, resulting in either 500, 1500 or 2000
estimates of impact per VEC (cf. Sect. 4.1.4). The error bars are the 95% “credible
interval” and represent the uncertainty in model parameters and natural variation
in density and/or distribution of the VECs (cf. Sect. 4.1.4). The credible interval is
analogous to confidence intervals and is used here to emphasize that the intervals are
calculated on simulated and not measured data.
The estimates falling within the different boundaries are counted and summed up
to give the percentage performance for one oil drift simulation. An example of this
is illustrated for oil drift simulation No. 16 in Fig. 4.3.