

26
2 Environmental Risk Management Applications …
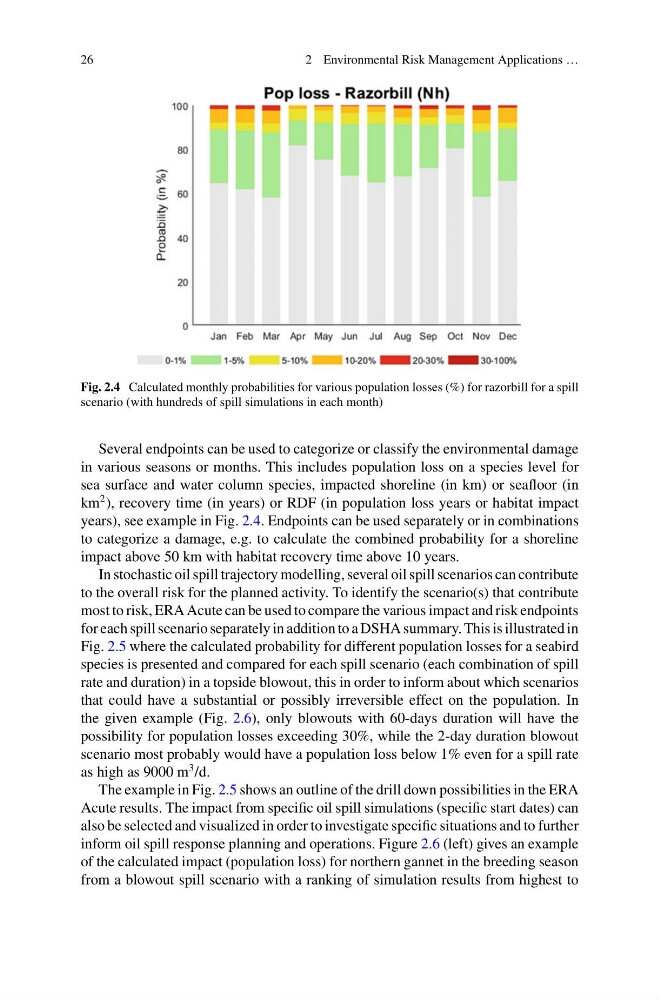
Fig. 2.4 Calculated monthly probabilities for various population losses (%) for razorbill for a spill
scenario (with hundreds of spill simulations in each month)
Several endpoints can be used to categorize or classify the environmental damage
in various seasons or months. This includes population loss on a species level for
sea surface and water column species, impacted shoreline (in km) or seafloor (in
km
2 ), recovery time (in years) or RDF (in population loss years or habitat impact
years), see example in Fig. 2.4. Endpoints can be used separately or in combinations
to categorize a damage, e.g. to calculate the combined probability for a shoreline
impact above 50 km with habitat recovery time above 10 years.
In stochastic oil spill trajectory modelling, several oil spill scenarios can contribute
to the overall risk for the planned activity. To identify the scenario(s) that contribute
most to risk, ERA Acute can be used to compare the various impact and risk endpoints
for each spill scenario separately in addition to a DSHA summary. This is illustrated in
Fig. 2.5 where the calculated probability for different population losses for a seabird
species is presented and compared for each spill scenario (each combination of spill
rate and duration) in a topside blowout, this in order to inform about which scenarios
that could have a substantial or possibly irreversible effect on the population. In
the given example (Fig. 2.6), only blowouts with 60-days duration will have the
possibility for population losses exceeding 30%, while the 2-day duration blowout
scenario most probably would have a population loss below 1% even for a spill rate
as high as 9000 m
3 /d.
The example in Fig. 2.5 shows an outline of the drill down possibilities in the ERA
Acute results. The impact from specific oil spill simulations (specific start dates) can
also be selected and visualized in order to investigate specific situations and to further
inform oil spill response planning and operations. Figure 2.6 (left) gives an example
of the calculated impact (population loss) for northern gannet in the breeding season
from a blowout spill scenario with a ranking of simulation results from highest to
2 Environmental Risk Management Applications …
Fig. 2.4 Calculated monthly probabilities for various population losses (%) for razorbill for a spill
scenario (with hundreds of spill simulations in each month)
Several endpoints can be used to categorize or classify the environmental damage
in various seasons or months. This includes population loss on a species level for
sea surface and water column species, impacted shoreline (in km) or seafloor (in
km
2 ), recovery time (in years) or RDF (in population loss years or habitat impact
years), see example in Fig. 2.4. Endpoints can be used separately or in combinations
to categorize a damage, e.g. to calculate the combined probability for a shoreline
impact above 50 km with habitat recovery time above 10 years.
In stochastic oil spill trajectory modelling, several oil spill scenarios can contribute
to the overall risk for the planned activity. To identify the scenario(s) that contribute
most to risk, ERA Acute can be used to compare the various impact and risk endpoints
for each spill scenario separately in addition to a DSHA summary. This is illustrated in
Fig. 2.5 where the calculated probability for different population losses for a seabird
species is presented and compared for each spill scenario (each combination of spill
rate and duration) in a topside blowout, this in order to inform about which scenarios
that could have a substantial or possibly irreversible effect on the population. In
the given example (Fig. 2.6), only blowouts with 60-days duration will have the
possibility for population losses exceeding 30%, while the 2-day duration blowout
scenario most probably would have a population loss below 1% even for a spill rate
as high as 9000 m
3 /d.
The example in Fig. 2.5 shows an outline of the drill down possibilities in the ERA
Acute results. The impact from specific oil spill simulations (specific start dates) can
also be selected and visualized in order to investigate specific situations and to further
inform oil spill response planning and operations. Figure 2.6 (left) gives an example
of the calculated impact (population loss) for northern gannet in the breeding season
from a blowout spill scenario with a ranking of simulation results from highest to