

2.4 Damage and Risk Assessment
25
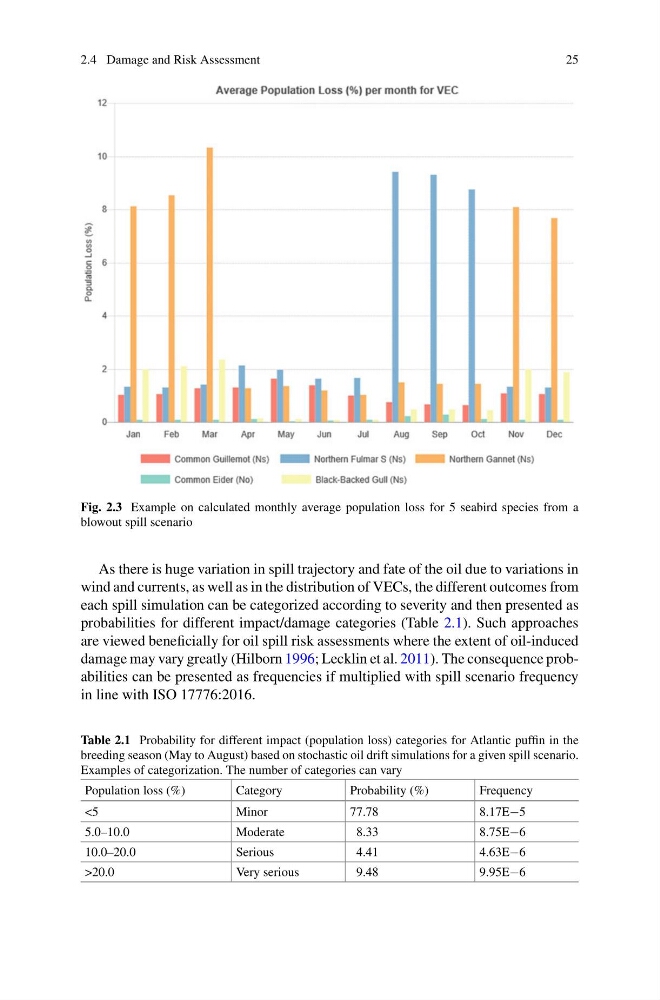
Fig. 2.3 Example on calculated monthly average population loss for 5 seabird species from a
blowout spill scenario
As there is huge variation in spill trajectory and fate of the oil due to variations in
wind and currents, as well as in the distribution of VECs, the different outcomes from
each spill simulation can be categorized according to severity and then presented as
probabilities for different impact/damage categories (Table 2.1). Such approaches
are viewed beneficially for oil spill risk assessments where the extent of oil-induced
damage may vary greatly (Hilborn 1996; Lecklin et al. 2011). The consequence probabilities can be presented as frequencies if multiplied with spill scenario frequency
in line with ISO 17776:2016.
Table 2.1 Probability for different impact (population loss) categories for Atlantic puffin in the
breeding season (May to August) based on stochastic oil drift simulations for a given spill scenario.
Examples of categorization. The number of categories can vary
Population loss (%)
Category
Probability (%)
Frequency
<5
Minor
77.78
8.17E−5
5.0–10.0
Moderate
8.33
8.75E−6
10.0–20.0
Serious
4.41
4.63E−6
>20.0
Very serious
9.48
9.95E−6
25
Fig. 2.3 Example on calculated monthly average population loss for 5 seabird species from a
blowout spill scenario
As there is huge variation in spill trajectory and fate of the oil due to variations in
wind and currents, as well as in the distribution of VECs, the different outcomes from
each spill simulation can be categorized according to severity and then presented as
probabilities for different impact/damage categories (Table 2.1). Such approaches
are viewed beneficially for oil spill risk assessments where the extent of oil-induced
damage may vary greatly (Hilborn 1996; Lecklin et al. 2011). The consequence probabilities can be presented as frequencies if multiplied with spill scenario frequency
in line with ISO 17776:2016.
Table 2.1 Probability for different impact (population loss) categories for Atlantic puffin in the
breeding season (May to August) based on stochastic oil drift simulations for a given spill scenario.
Examples of categorization. The number of categories can vary
Population loss (%)
Category
Probability (%)
Frequency
<5
Minor
77.78
8.17E−5
5.0–10.0
Moderate
8.33
8.75E−6
10.0–20.0
Serious
4.41
4.63E−6
>20.0
Very serious
9.48
9.95E−6