

2.4 Damage and Risk Assessment
27
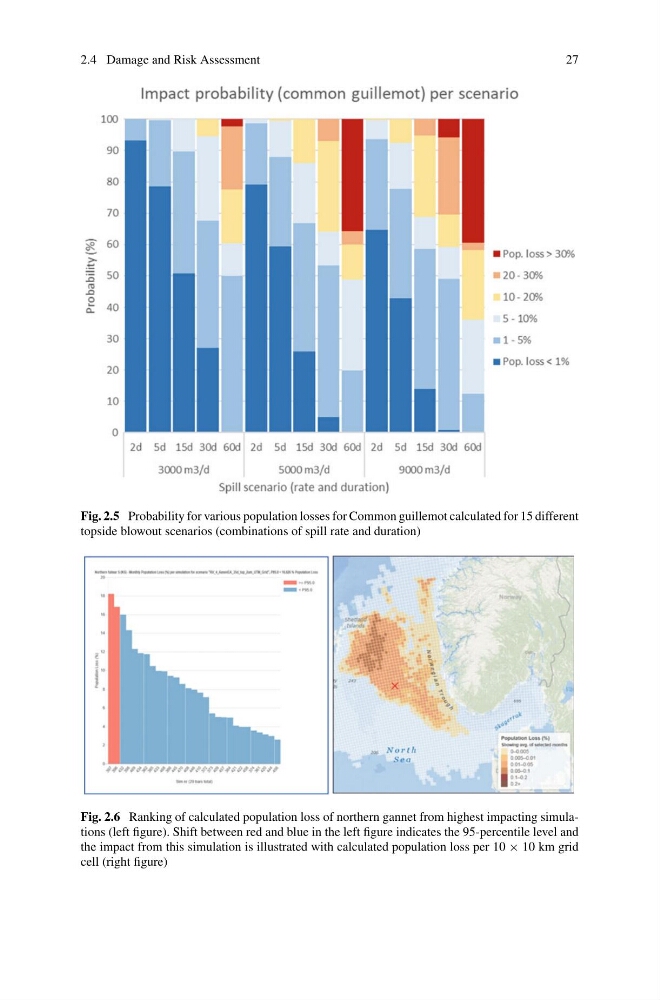
Fig. 2.5 Probability for various population losses for Common guillemot calculated for 15 different
topside blowout scenarios (combinations of spill rate and duration)
Fig. 2.6 Ranking of calculated population loss of northern gannet from highest impacting simulations (left figure). Shift between red and blue in the left figure indicates the 95-percentile level and
the impact from this simulation is illustrated with calculated population loss per 10 × 10 km grid
cell (right figure)
27
Fig. 2.5 Probability for various population losses for Common guillemot calculated for 15 different
topside blowout scenarios (combinations of spill rate and duration)
Fig. 2.6 Ranking of calculated population loss of northern gannet from highest impacting simulations (left figure). Shift between red and blue in the left figure indicates the 95-percentile level and
the impact from this simulation is illustrated with calculated population loss per 10 × 10 km grid
cell (right figure)