

1.5 From Spill Scenario to Case and from Damage to Risk
13
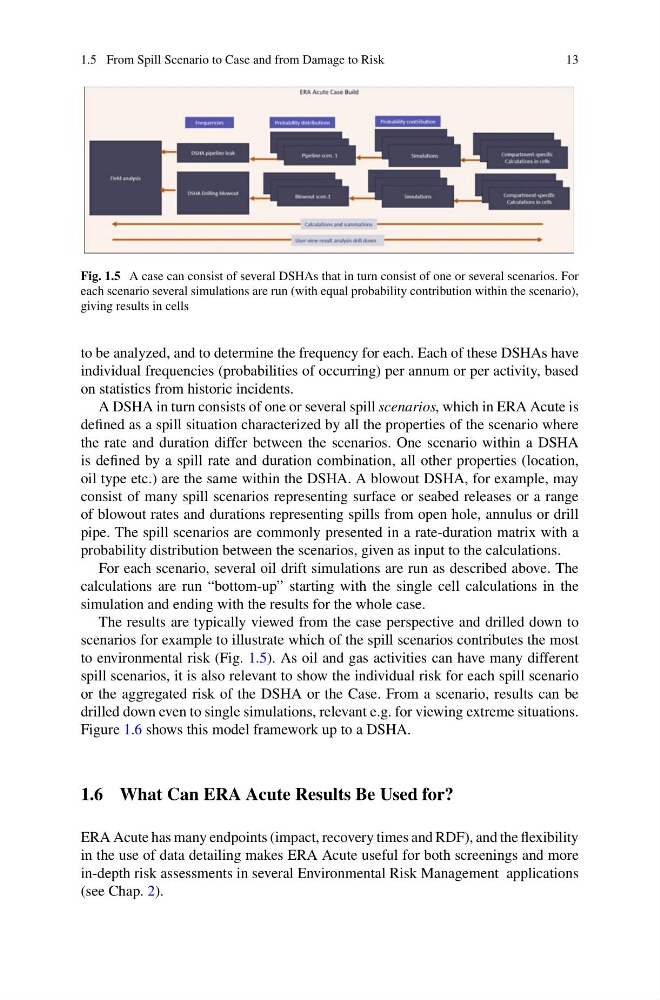
Fig. 1.5 A case can consist of several DSHAs that in turn consist of one or several scenarios. For
each scenario several simulations are run (with equal probability contribution within the scenario),
giving results in cells
to be analyzed, and to determine the frequency for each. Each of these DSHAs have
individual frequencies (probabilities of occurring) per annum or per activity, based
on statistics from historic incidents.
A DSHA in turn consists of one or several spill scenarios, which in ERA Acute is
defined as a spill situation characterized by all the properties of the scenario where
the rate and duration differ between the scenarios. One scenario within a DSHA
is defined by a spill rate and duration combination, all other properties (location,
oil type etc.) are the same within the DSHA. A blowout DSHA, for example, may
consist of many spill scenarios representing surface or seabed releases or a range
of blowout rates and durations representing spills from open hole, annulus or drill
pipe. The spill scenarios are commonly presented in a rate-duration matrix with a
probability distribution between the scenarios, given as input to the calculations.
For each scenario, several oil drift simulations are run as described above. The
calculations are run “bottom-up” starting with the single cell calculations in the
simulation and ending with the results for the whole case.
The results are typically viewed from the case perspective and drilled down to
scenarios for example to illustrate which of the spill scenarios contributes the most
to environmental risk (Fig. 1.5). As oil and gas activities can have many different
spill scenarios, it is also relevant to show the individual risk for each spill scenario
or the aggregated risk of the DSHA or the Case. From a scenario, results can be
drilled down even to single simulations, relevant e.g. for viewing extreme situations.
Figure 1.6 shows this model framework up to a DSHA.
1.6 What Can ERA Acute Results Be Used for?
ERA Acute has many endpoints (impact, recovery times and RDF), and the flexibility
in the use of data detailing makes ERA Acute useful for both screenings and more
in-depth risk assessments in several Environmental Risk Management applications
(see Chap. 2).
13
Fig. 1.5 A case can consist of several DSHAs that in turn consist of one or several scenarios. For
each scenario several simulations are run (with equal probability contribution within the scenario),
giving results in cells
to be analyzed, and to determine the frequency for each. Each of these DSHAs have
individual frequencies (probabilities of occurring) per annum or per activity, based
on statistics from historic incidents.
A DSHA in turn consists of one or several spill scenarios, which in ERA Acute is
defined as a spill situation characterized by all the properties of the scenario where
the rate and duration differ between the scenarios. One scenario within a DSHA
is defined by a spill rate and duration combination, all other properties (location,
oil type etc.) are the same within the DSHA. A blowout DSHA, for example, may
consist of many spill scenarios representing surface or seabed releases or a range
of blowout rates and durations representing spills from open hole, annulus or drill
pipe. The spill scenarios are commonly presented in a rate-duration matrix with a
probability distribution between the scenarios, given as input to the calculations.
For each scenario, several oil drift simulations are run as described above. The
calculations are run “bottom-up” starting with the single cell calculations in the
simulation and ending with the results for the whole case.
The results are typically viewed from the case perspective and drilled down to
scenarios for example to illustrate which of the spill scenarios contributes the most
to environmental risk (Fig. 1.5). As oil and gas activities can have many different
spill scenarios, it is also relevant to show the individual risk for each spill scenario
or the aggregated risk of the DSHA or the Case. From a scenario, results can be
drilled down even to single simulations, relevant e.g. for viewing extreme situations.
Figure 1.6 shows this model framework up to a DSHA.
1.6 What Can ERA Acute Results Be Used for?
ERA Acute has many endpoints (impact, recovery times and RDF), and the flexibility
in the use of data detailing makes ERA Acute useful for both screenings and more
in-depth risk assessments in several Environmental Risk Management applications
(see Chap. 2).