

14
1 Introduction to the Concepts and Use of ERA Acute
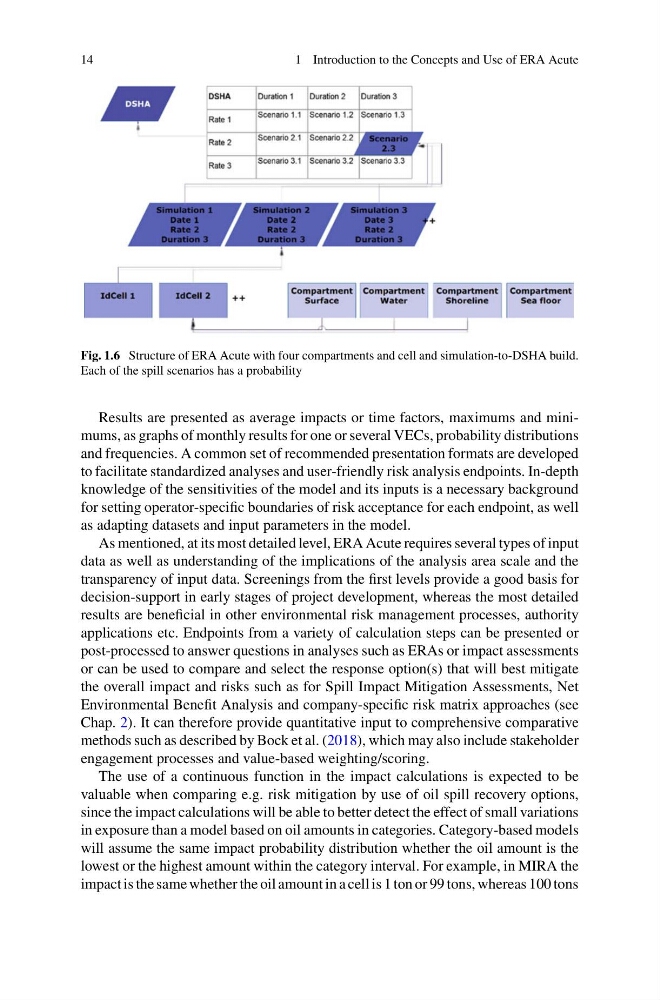
Fig. 1.6 Structure of ERA Acute with four compartments and cell and simulation-to-DSHA build.
Each of the spill scenarios has a probability
Results are presented as average impacts or time factors, maximums and minimums, as graphs of monthly results for one or several VECs, probability distributions
and frequencies. A common set of recommended presentation formats are developed
to facilitate standardized analyses and user-friendly risk analysis endpoints. In-depth
knowledge of the sensitivities of the model and its inputs is a necessary background
for setting operator-specific boundaries of risk acceptance for each endpoint, as well
as adapting datasets and input parameters in the model.
As mentioned, at its most detailed level, ERA Acute requires several types of input
data as well as understanding of the implications of the analysis area scale and the
transparency of input data. Screenings from the first levels provide a good basis for
decision-support in early stages of project development, whereas the most detailed
results are beneficial in other environmental risk management processes, authority
applications etc. Endpoints from a variety of calculation steps can be presented or
post-processed to answer questions in analyses such as ERAs or impact assessments
or can be used to compare and select the response option(s) that will best mitigate
the overall impact and risks such as for Spill Impact Mitigation Assessments, Net
Environmental Benefit Analysis and company-specific risk matrix approaches (see
Chap. 2). It can therefore provide quantitative input to comprehensive comparative
methods such as described by Bock et al. (2018), which may also include stakeholder
engagement processes and value-based weighting/scoring.
The use of a continuous function in the impact calculations is expected to be
valuable when comparing e.g. risk mitigation by use of oil spill recovery options,
since the impact calculations will be able to better detect the effect of small variations
in exposure than a model based on oil amounts in categories. Category-based models
will assume the same impact probability distribution whether the oil amount is the
lowest or the highest amount within the category interval. For example, in MIRA the
impact is the same whether the oil amount in a cell is 1 ton or 99 tons, whereas 100 tons
1 Introduction to the Concepts and Use of ERA Acute
Fig. 1.6 Structure of ERA Acute with four compartments and cell and simulation-to-DSHA build.
Each of the spill scenarios has a probability
Results are presented as average impacts or time factors, maximums and minimums, as graphs of monthly results for one or several VECs, probability distributions
and frequencies. A common set of recommended presentation formats are developed
to facilitate standardized analyses and user-friendly risk analysis endpoints. In-depth
knowledge of the sensitivities of the model and its inputs is a necessary background
for setting operator-specific boundaries of risk acceptance for each endpoint, as well
as adapting datasets and input parameters in the model.
As mentioned, at its most detailed level, ERA Acute requires several types of input
data as well as understanding of the implications of the analysis area scale and the
transparency of input data. Screenings from the first levels provide a good basis for
decision-support in early stages of project development, whereas the most detailed
results are beneficial in other environmental risk management processes, authority
applications etc. Endpoints from a variety of calculation steps can be presented or
post-processed to answer questions in analyses such as ERAs or impact assessments
or can be used to compare and select the response option(s) that will best mitigate
the overall impact and risks such as for Spill Impact Mitigation Assessments, Net
Environmental Benefit Analysis and company-specific risk matrix approaches (see
Chap. 2). It can therefore provide quantitative input to comprehensive comparative
methods such as described by Bock et al. (2018), which may also include stakeholder
engagement processes and value-based weighting/scoring.
The use of a continuous function in the impact calculations is expected to be
valuable when comparing e.g. risk mitigation by use of oil spill recovery options,
since the impact calculations will be able to better detect the effect of small variations
in exposure than a model based on oil amounts in categories. Category-based models
will assume the same impact probability distribution whether the oil amount is the
lowest or the highest amount within the category interval. For example, in MIRA the
impact is the same whether the oil amount in a cell is 1 ton or 99 tons, whereas 100 tons