

4.3 Catalytic Chemistry
183
Wavelength (nm)
(a)
(b)
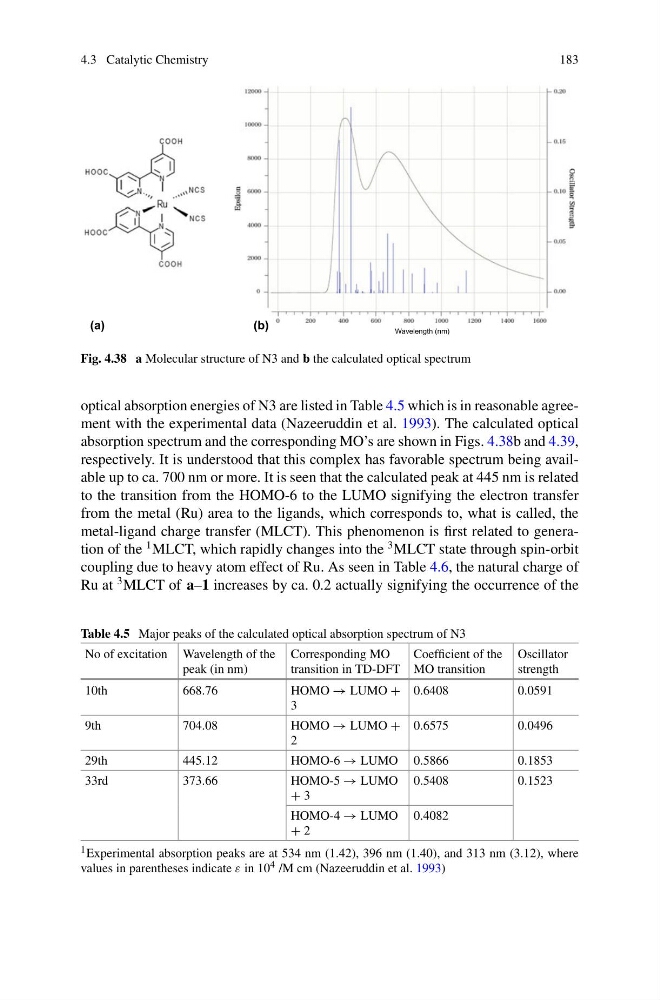
Fig. 4.38 a Molecular structure of N3 and b the calculated optical spectrum
optical absorption energies of N3 are listed in Table 4.5 which is in reasonable agreement with the experimental data (Nazeeruddin et al. 1993). The calculated optical
absorption spectrum and the corresponding MO’s are shown in Figs. 4.38b and 4.39,
respectively. It is understood that this complex has favorable spectrum being available up to ca. 700 nm or more. It is seen that the calculated peak at 445 nm is related
to the transition from the HOMO-6 to the LUMO signifying the electron transfer
from the metal (Ru) area to the ligands, which corresponds to, what is called, the
metal-ligand charge transfer (MLCT). This phenomenon is first related to generation of the
1 MLCT, which rapidly changes into the
3 MLCT state through spin-orbit
coupling due to heavy atom effect of Ru. As seen in Table 4.6, the natural charge of
Ru at
3 MLCT of a–1 increases by ca. 0.2 actually signifying the occurrence of the
Table 4.5 Major peaks of the calculated optical absorption spectrum of N3
No of excitation Wavelength of the
peak (in nm)
Corresponding MO
transition in TD-DFT
Coefficient of the
MO transition
Oscillator
strength
10th
668.76
HOMO → LUMO +
3
0.6408
0.0591
9th
704.08
HOMO → LUMO +
2
0.6575
0.0496
29th
445.12
HOMO-6 → LUMO 0.5866
0.1853
33rd
373.66
HOMO-5 → LUMO
+ 3
0.5408
0.1523
HOMO-4 → LUMO
+ 2
0.4082
1 Experimental absorption peaks are at 534 nm (1.42), 396 nm (1.40), and 313 nm (3.12), where
values in parentheses indicate ε in 10 4 /M cm (Nazeeruddin et al. 1993)
183
Wavelength (nm)
(a)
(b)
Fig. 4.38 a Molecular structure of N3 and b the calculated optical spectrum
optical absorption energies of N3 are listed in Table 4.5 which is in reasonable agreement with the experimental data (Nazeeruddin et al. 1993). The calculated optical
absorption spectrum and the corresponding MO’s are shown in Figs. 4.38b and 4.39,
respectively. It is understood that this complex has favorable spectrum being available up to ca. 700 nm or more. It is seen that the calculated peak at 445 nm is related
to the transition from the HOMO-6 to the LUMO signifying the electron transfer
from the metal (Ru) area to the ligands, which corresponds to, what is called, the
metal-ligand charge transfer (MLCT). This phenomenon is first related to generation of the
1 MLCT, which rapidly changes into the
3 MLCT state through spin-orbit
coupling due to heavy atom effect of Ru. As seen in Table 4.6, the natural charge of
Ru at
3 MLCT of a–1 increases by ca. 0.2 actually signifying the occurrence of the
Table 4.5 Major peaks of the calculated optical absorption spectrum of N3
No of excitation Wavelength of the
peak (in nm)
Corresponding MO
transition in TD-DFT
Coefficient of the
MO transition
Oscillator
strength
10th
668.76
HOMO → LUMO +
3
0.6408
0.0591
9th
704.08
HOMO → LUMO +
2
0.6575
0.0496
29th
445.12
HOMO-6 → LUMO 0.5866
0.1853
33rd
373.66
HOMO-5 → LUMO
+ 3
0.5408
0.1523
HOMO-4 → LUMO
+ 2
0.4082
1 Experimental absorption peaks are at 534 nm (1.42), 396 nm (1.40), and 313 nm (3.12), where
values in parentheses indicate ε in 10 4 /M cm (Nazeeruddin et al. 1993)