

4.3 Catalytic Chemistry
181
Population change
R1 PC1 TS1a I1 TS1b P1
R1 PC1 TS1a I1 TS1b P1
Pd system
Pt system
Pd system
Pt system
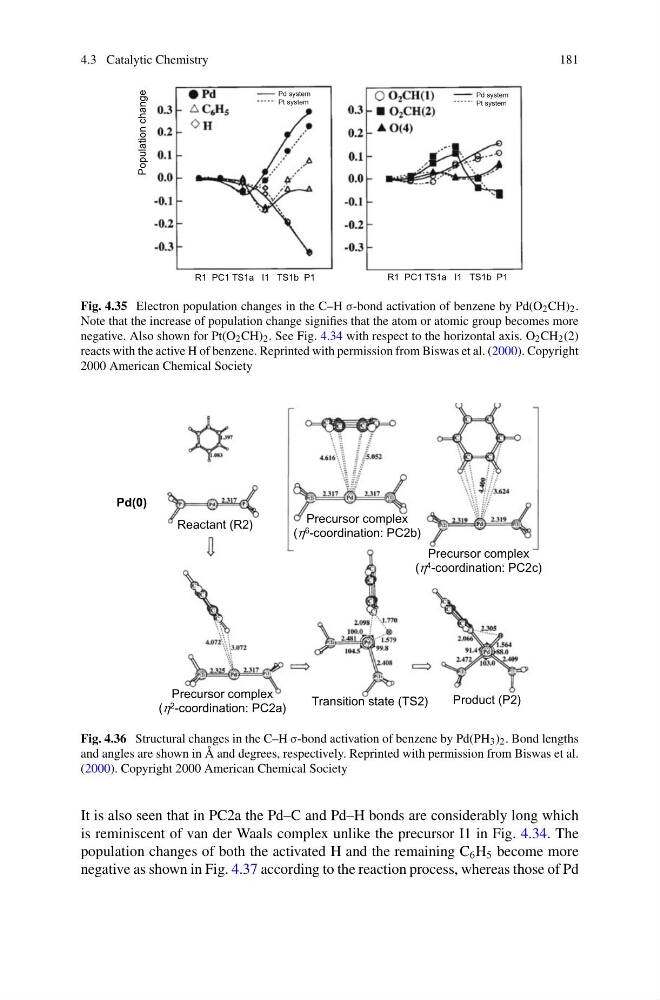
Fig. 4.35 Electron population changes in the C–H σ-bond activation of benzene by Pd(O 2 CH) 2 .
Note that the increase of population change signifies that the atom or atomic group becomes more
negative. Also shown for Pt(O 2 CH) 2 . See Fig. 4.34 with respect to the horizontal axis. O 2 CH 2 (2)
reacts with the active H of benzene. Reprinted with permission from Biswas et al. (2000). Copyright
2000 American Chemical Society
Precursor complex
(η 6 -coordination: PC2b)
Reactant (R2)
Precursor complex
(η 4 -coordination: PC2c)
Precursor complex
(η 2 -coordination: PC2a)
Transition state (TS2)
Product (P2)
Pd(0)
Fig. 4.36 Structural changes in the C–H σ-bond activation of benzene by Pd(PH 3 ) 2 . Bond lengths
and angles are shown in Å and degrees, respectively. Reprinted with permission from Biswas et al.
(2000). Copyright 2000 American Chemical Society
It is also seen that in PC2a the Pd–C and Pd–H bonds are considerably long which
is reminiscent of van der Waals complex unlike the precursor I1 in Fig. 4.34. The
population changes of both the activated H and the remaining C 6 H 5 become more
negative as shown in Fig. 4.37 according to the reaction process, whereas those of Pd
181
Population change
R1 PC1 TS1a I1 TS1b P1
R1 PC1 TS1a I1 TS1b P1
Pd system
Pt system
Pd system
Pt system
Fig. 4.35 Electron population changes in the C–H σ-bond activation of benzene by Pd(O 2 CH) 2 .
Note that the increase of population change signifies that the atom or atomic group becomes more
negative. Also shown for Pt(O 2 CH) 2 . See Fig. 4.34 with respect to the horizontal axis. O 2 CH 2 (2)
reacts with the active H of benzene. Reprinted with permission from Biswas et al. (2000). Copyright
2000 American Chemical Society
Precursor complex
(η 6 -coordination: PC2b)
Reactant (R2)
Precursor complex
(η 4 -coordination: PC2c)
Precursor complex
(η 2 -coordination: PC2a)
Transition state (TS2)
Product (P2)
Pd(0)
Fig. 4.36 Structural changes in the C–H σ-bond activation of benzene by Pd(PH 3 ) 2 . Bond lengths
and angles are shown in Å and degrees, respectively. Reprinted with permission from Biswas et al.
(2000). Copyright 2000 American Chemical Society
It is also seen that in PC2a the Pd–C and Pd–H bonds are considerably long which
is reminiscent of van der Waals complex unlike the precursor I1 in Fig. 4.34. The
population changes of both the activated H and the remaining C 6 H 5 become more
negative as shown in Fig. 4.37 according to the reaction process, whereas those of Pd