

180
4 Toward More Sophisticated Problems
Reactant (R1)
Precursor complex (PC1)
Transition state (TS1a)
Transition state (TS1b)
Product (P1)
Intermediate (I1)
Pd(II)
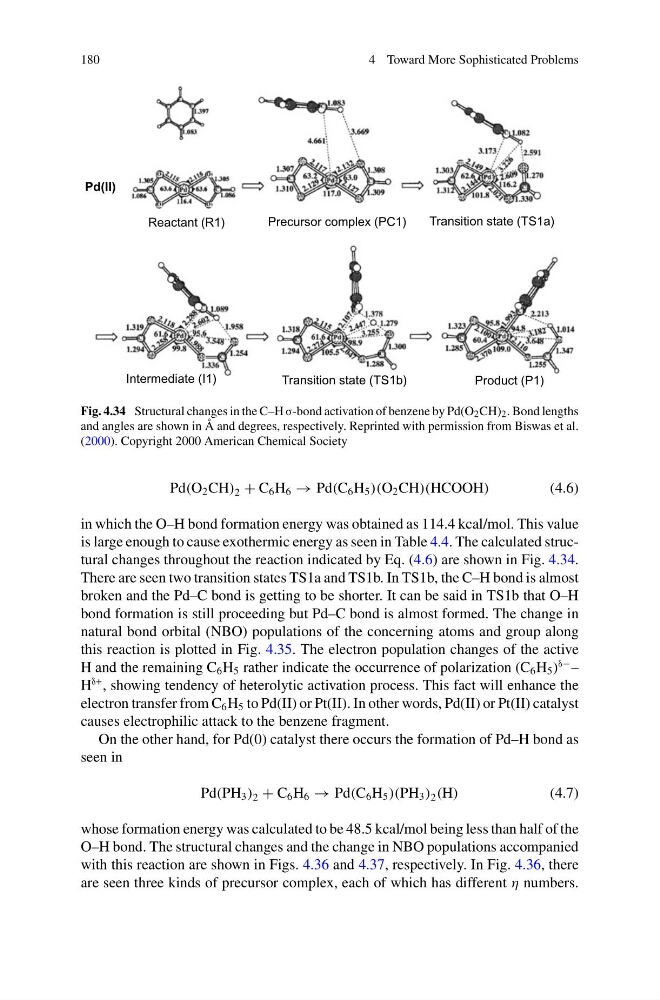
Fig. 4.34 Structural changes in the C–H σ-bond activation of benzene by Pd(O 2 CH) 2 . Bond lengths
and angles are shown in Å and degrees, respectively. Reprinted with permission from Biswas et al.
(2000). Copyright 2000 American Chemical Society
Pd(O 2 CH) 2 + C 6 H 6 → Pd(C 6 H 5 )(O 2 CH)(HCOOH)
(4.6)
in which the O–H bond formation energy was obtained as 114.4 kcal/mol. This value
is large enough to cause exothermic energy as seen in Table 4.4. The calculated structural changes throughout the reaction indicated by Eq. (4.6) are shown in Fig. 4.34.
There are seen two transition states TS1a and TS1b. In TS1b, the C–H bond is almost
broken and the Pd–C bond is getting to be shorter. It can be said in TS1b that O–H
bond formation is still proceeding but Pd–C bond is almost formed. The change in
natural bond orbital (NBO) populations of the concerning atoms and group along
this reaction is plotted in Fig. 4.35. The electron population changes of the active
H and the remaining C 6 H 5 rather indicate the occurrence of polarization (C 6 H 5 )
δ− –
H
δ+ , showing tendency of heterolytic activation process. This fact will enhance the
electron transfer from C 6 H 5 to Pd(II) or Pt(II). In other words, Pd(II) or Pt(II) catalyst
causes electrophilic attack to the benzene fragment.
On the other hand, for Pd(0) catalyst there occurs the formation of Pd–H bond as
seen in
Pd(PH 3 ) 2 + C 6 H 6 → Pd(C 6 H 5 )(PH 3 ) 2 (H)
(4.7)
whose formation energy was calculated to be 48.5 kcal/mol being less than half of the
O–H bond. The structural changes and the change in NBO populations accompanied
with this reaction are shown in Figs. 4.36 and 4.37, respectively. In Fig. 4.36, there
are seen three kinds of precursor complex, each of which has different η numbers.
4 Toward More Sophisticated Problems
Reactant (R1)
Precursor complex (PC1)
Transition state (TS1a)
Transition state (TS1b)
Product (P1)
Intermediate (I1)
Pd(II)
Fig. 4.34 Structural changes in the C–H σ-bond activation of benzene by Pd(O 2 CH) 2 . Bond lengths
and angles are shown in Å and degrees, respectively. Reprinted with permission from Biswas et al.
(2000). Copyright 2000 American Chemical Society
Pd(O 2 CH) 2 + C 6 H 6 → Pd(C 6 H 5 )(O 2 CH)(HCOOH)
(4.6)
in which the O–H bond formation energy was obtained as 114.4 kcal/mol. This value
is large enough to cause exothermic energy as seen in Table 4.4. The calculated structural changes throughout the reaction indicated by Eq. (4.6) are shown in Fig. 4.34.
There are seen two transition states TS1a and TS1b. In TS1b, the C–H bond is almost
broken and the Pd–C bond is getting to be shorter. It can be said in TS1b that O–H
bond formation is still proceeding but Pd–C bond is almost formed. The change in
natural bond orbital (NBO) populations of the concerning atoms and group along
this reaction is plotted in Fig. 4.35. The electron population changes of the active
H and the remaining C 6 H 5 rather indicate the occurrence of polarization (C 6 H 5 )
δ− –
H
δ+ , showing tendency of heterolytic activation process. This fact will enhance the
electron transfer from C 6 H 5 to Pd(II) or Pt(II). In other words, Pd(II) or Pt(II) catalyst
causes electrophilic attack to the benzene fragment.
On the other hand, for Pd(0) catalyst there occurs the formation of Pd–H bond as
seen in
Pd(PH 3 ) 2 + C 6 H 6 → Pd(C 6 H 5 )(PH 3 ) 2 (H)
(4.7)
whose formation energy was calculated to be 48.5 kcal/mol being less than half of the
O–H bond. The structural changes and the change in NBO populations accompanied
with this reaction are shown in Figs. 4.36 and 4.37, respectively. In Fig. 4.36, there
are seen three kinds of precursor complex, each of which has different η numbers.