

128
3 Fundamentals of the Analysis Tools
ε s (k)
0
k
π/a
ε s (k)
0
k
π/a
HO band
HO band
LU band
LU band
Direct
band gap
Indirect
band gap
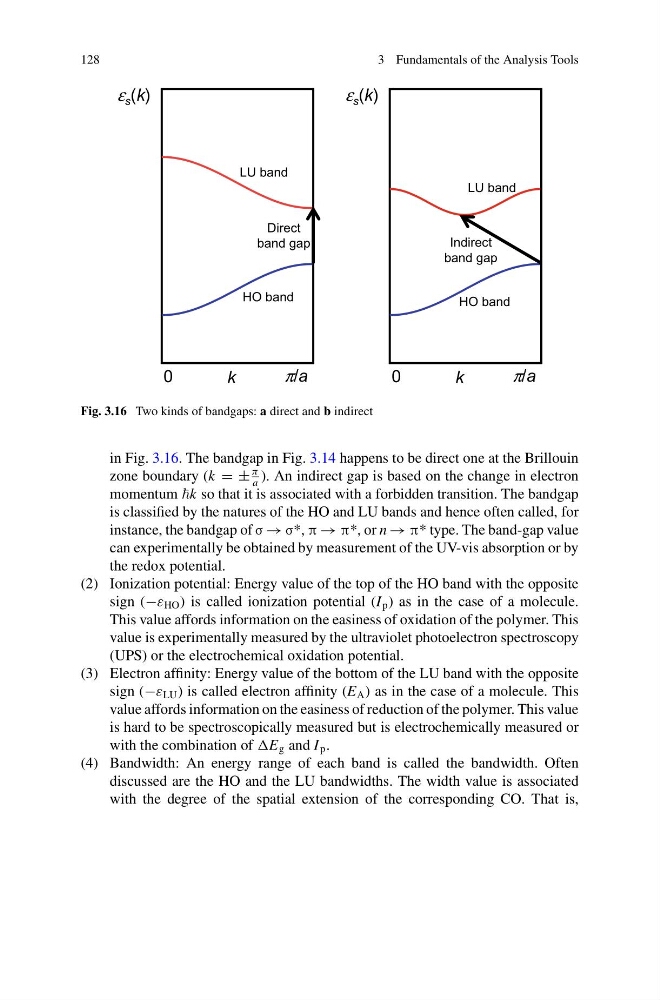
Fig. 3.16 Two kinds of bandgaps: a direct and b indirect
in Fig. 3.16. The bandgap in Fig. 3.14 happens to be direct one at the Brillouin
zone boundary (k = ±
π
a
). An indirect gap is based on the change in electron
momentum so that it is associated with a forbidden transition. The bandgap
is classified by the natures of the HO and LU bands and hence often called, for
instance, the bandgap of σ → σ*, π → π*, or n → π* type. The band-gap value
can experimentally be obtained by measurement of the UV-vis absorption or by
the redox potential.
(2) Ionization potential: Energy value of the top of the HO band with the opposite
sign (−ε HO ) is called ionization potential (I p ) as in the case of a molecule.
This value affords information on the easiness of oxidation of the polymer. This
value is experimentally measured by the ultraviolet photoelectron spectroscopy
(UPS) or the electrochemical oxidation potential.
(3) Electron affinity: Energy value of the bottom of the LU band with the opposite
sign (−ε LU ) is called electron affinity (E A ) as in the case of a molecule. This
value affords information on the easiness of reduction of the polymer. This value
is hard to be spectroscopically measured but is electrochemically measured or
with the combination of g and I p .
(4) Bandwidth: An energy range of each band is called the bandwidth. Often
discussed are the HO and the LU bandwidths. The width value is associated
with the degree of the spatial extension of the corresponding CO. That is,
3 Fundamentals of the Analysis Tools
ε s (k)
0
k
π/a
ε s (k)
0
k
π/a
HO band
HO band
LU band
LU band
Direct
band gap
Indirect
band gap
Fig. 3.16 Two kinds of bandgaps: a direct and b indirect
in Fig. 3.16. The bandgap in Fig. 3.14 happens to be direct one at the Brillouin
zone boundary (k = ±
π
a
). An indirect gap is based on the change in electron
momentum so that it is associated with a forbidden transition. The bandgap
is classified by the natures of the HO and LU bands and hence often called, for
instance, the bandgap of σ → σ*, π → π*, or n → π* type. The band-gap value
can experimentally be obtained by measurement of the UV-vis absorption or by
the redox potential.
(2) Ionization potential: Energy value of the top of the HO band with the opposite
sign (−ε HO ) is called ionization potential (I p ) as in the case of a molecule.
This value affords information on the easiness of oxidation of the polymer. This
value is experimentally measured by the ultraviolet photoelectron spectroscopy
(UPS) or the electrochemical oxidation potential.
(3) Electron affinity: Energy value of the bottom of the LU band with the opposite
sign (−ε LU ) is called electron affinity (E A ) as in the case of a molecule. This
value affords information on the easiness of reduction of the polymer. This value
is hard to be spectroscopically measured but is electrochemically measured or
with the combination of g and I p .
(4) Bandwidth: An energy range of each band is called the bandwidth. Often
discussed are the HO and the LU bandwidths. The width value is associated
with the degree of the spatial extension of the corresponding CO. That is,