

and it is “weak” in mitigation according to Table 3.10. Therefore, the mitigation
performance of the vadose zone is not evaluated in this case. In other words, only
the hazard of groundwater pollution sources is evaluated.
Based on the findings of landfill investigation, indicator-specific scores are
given: 8 for landfill volume (Y1) which numbers 400,000 m
3 ; 10 for landfill period
(Y2) spans 15 years; 8 for landfill type (Y4) as mainly MSW is landfilled; 6 for
maximum leachate production (Y3) which attains 1 Â 10
4 m
3 /a to 5 Â 10
4 m
3 /a;
10 for seepage control (Y5) as no such measures are taken; and 10 for leachate
treatment (Y6) as there is no collection or treatment system. Using Eq. (3.1), the
hazard index of the landfill is calculated to be 8.4408, which reaches Grade III.
The groundwater pollution source intensity is rated Grade III, the same as
pollution source hazard as indicated in Fig. 3.3. The landfill is classified into priority sites for pollution control.
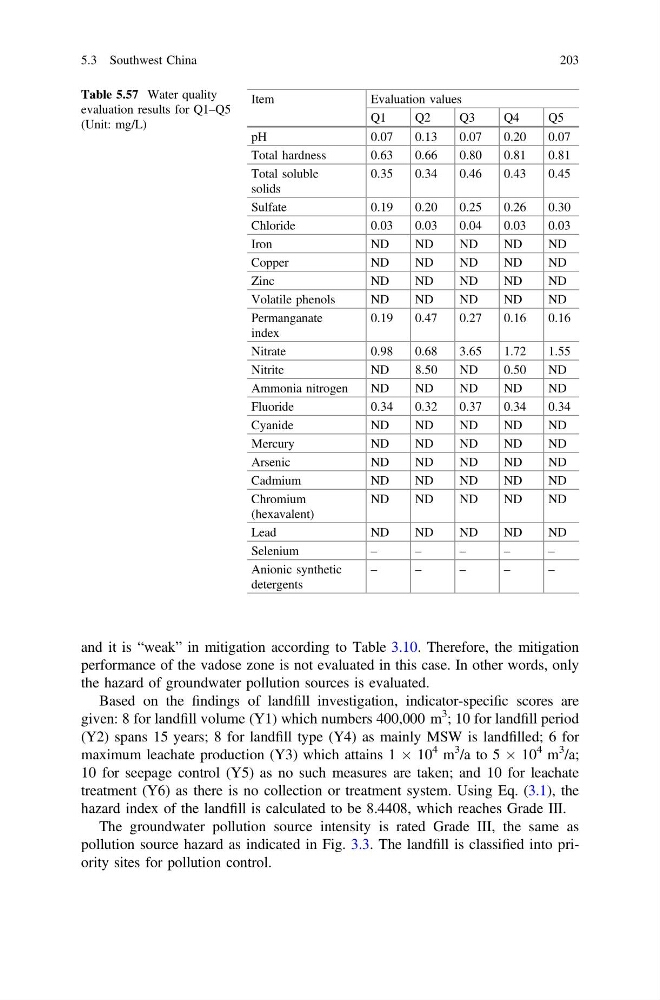
Table 5.57 Water quality
evaluation results for Q1–Q5
(Unit: mg/L)
Item
Evaluation values
Q1
Q2
Q3
Q4
Q5
pH
0.07
0.13
0.07
0.20
0.07
Total hardness
0.63
0.66
0.80
0.81
0.81
Total soluble
solids
0.35
0.34
0.46
0.43
0.45
Sulfate
0.19
0.20
0.25
0.26
0.30
Chloride
0.03
0.03
0.04
0.03
0.03
Iron
ND
ND
ND
ND
ND
Copper
ND
ND
ND
ND
ND
Zinc
ND
ND
ND
ND
ND
Volatile phenols
ND
ND
ND
ND
ND
Permanganate
index
0.19
0.47
0.27
0.16
0.16
Nitrate
0.98
0.68
3.65
1.72
1.55
Nitrite
ND
8.50
ND
0.50
ND
Ammonia nitrogen
ND
ND
ND
ND
ND
Fluoride
0.34
0.32
0.37
0.34
0.34
Cyanide
ND
ND
ND
ND
ND
Mercury
ND
ND
ND
ND
ND
Arsenic
ND
ND
ND
ND
ND
Cadmium
ND
ND
ND
ND
ND
Chromium
(hexavalent)
ND
ND
ND
ND
ND
Lead
ND
ND
ND
ND
ND
Selenium
–
–
–
–
–
Anionic synthetic
detergents
–
–
–
–
–
5.3 Southwest China
203
performance of the vadose zone is not evaluated in this case. In other words, only
the hazard of groundwater pollution sources is evaluated.
Based on the findings of landfill investigation, indicator-specific scores are
given: 8 for landfill volume (Y1) which numbers 400,000 m
3 ; 10 for landfill period
(Y2) spans 15 years; 8 for landfill type (Y4) as mainly MSW is landfilled; 6 for
maximum leachate production (Y3) which attains 1 Â 10
4 m
3 /a to 5 Â 10
4 m
3 /a;
10 for seepage control (Y5) as no such measures are taken; and 10 for leachate
treatment (Y6) as there is no collection or treatment system. Using Eq. (3.1), the
hazard index of the landfill is calculated to be 8.4408, which reaches Grade III.
The groundwater pollution source intensity is rated Grade III, the same as
pollution source hazard as indicated in Fig. 3.3. The landfill is classified into priority sites for pollution control.
Table 5.57 Water quality
evaluation results for Q1–Q5
(Unit: mg/L)
Item
Evaluation values
Q1
Q2
Q3
Q4
Q5
pH
0.07
0.13
0.07
0.20
0.07
Total hardness
0.63
0.66
0.80
0.81
0.81
Total soluble
solids
0.35
0.34
0.46
0.43
0.45
Sulfate
0.19
0.20
0.25
0.26
0.30
Chloride
0.03
0.03
0.04
0.03
0.03
Iron
ND
ND
ND
ND
ND
Copper
ND
ND
ND
ND
ND
Zinc
ND
ND
ND
ND
ND
Volatile phenols
ND
ND
ND
ND
ND
Permanganate
index
0.19
0.47
0.27
0.16
0.16
Nitrate
0.98
0.68
3.65
1.72
1.55
Nitrite
ND
8.50
ND
0.50
ND
Ammonia nitrogen
ND
ND
ND
ND
ND
Fluoride
0.34
0.32
0.37
0.34
0.34
Cyanide
ND
ND
ND
ND
ND
Mercury
ND
ND
ND
ND
ND
Arsenic
ND
ND
ND
ND
ND
Cadmium
ND
ND
ND
ND
ND
Chromium
(hexavalent)
ND
ND
ND
ND
ND
Lead
ND
ND
ND
ND
ND
Selenium
–
–
–
–
–
Anionic synthetic
detergents
–
–
–
–
–
5.3 Southwest China
203